Table of Contents
8.08. Customer budgets
This feature enables you to manage the budgets of customers in your system. Remember, in mSupply customers are names to which you supply goods. To enable the feature you need to turn it on and then set preferences for its use and allocate budgets to your customers. When using it, you see extra fields on a customer invoice which tell you how much budget the customer has been allocated and the amount you have remaining. Once a customer has reached their budget limit a customer invoice cannot be confirmed unless it is first authorised. All the details you need are below.
Setting up the customer budgets feature
Turning the feature on: File preferences
- Go to File > Preferences…
- Select the Invoices 1 tab.
- Check the 'Per customer budgets' checkbox. Note that 'Activate budget module' must be checked first and you should have previously set up your budget periods (see Budgets for details).
- After clicking Per customer budgets checkbox confirm dialog box is shown with message “Turning on the customer budgets functionality requires that the preferences for authorising customer invoices be turned on and automatically confirming and finalising customer invoices be turned off. Is this OK?”
- You must click OK to activate the functionality. When you do, the “Customer invoices must be authorised” and “Authorisation needed only if over budget” store preferences are turned on for all stores.
- Optionally, you can divide budget periods up into smaller equal parts and apply the same fractional amount of the period budget to each part-period. For example, if your budget period is a year you might want to split this up into quarters and allow customers to freely spend up to a quarter of their annual budget in this time. To activate these additional limits check the Apply part-period limits checkbox and type into the textbox the number of part-periods you want to split the budget periods into. To split annual periods into quarters you would enter 4 into the textbox:

Note that any unused amounts of part-period budgets roll over to the next part-period. Full period budget amounts do not roll over to the next period.
Configuration: Store preferences
- If Per customer budgets is turned on then “Customer invoices must be authorised” checkbox and “Authorisation needed only if over budget” are turned on. This is done automatically for you when you turn the feature on (as mentioned above). You can, however, uncheck these checkboxes for individual stores to have the feature work in different ways:
- “Customer invoices must be authorised” and “Authorisation needed only if over budget” both checked - customer invoices can be confirmed freely until the budget limit is reached. After that, customer invoices must be authorised before they can be confirmed.
- “Customer invoices must be authorised” and “Authorisation needed only if over budget” both unchecked - mSupply will display the budget information on the customer invoice but it will not enforce the budget.
- “Customer invoices must be authorised” checked, “Authorisation needed only if over budget” unchecked - all customer invoices must be authorised, regardless of whether the customer has exceeded their budget.

Add budget periods
- These are the system-wide budget periods that mSupply uses for its budget functionality. Customer budgets are assigned to these budget periods so you must set them up before you can start setting up individual customer budgets.
- From the Navigator click the drop down menu Special > Show budgets…. You click on the New button to create a new budget period but for the full details please see Budgets.
Setup: Set individual customers' budgets
If you have a lot of customers to setup budgets for, you might like to import them instead. See the 17.06. Importing customer budgets page for details on that.
- Note that if you want to set up many or all customers' budgets at one time you can use the import feature, details of which are here
- To set up the budget for each customer, go to Customer > Show customers…, click on the Find button, and double click on the first customer to show their details
- Click on the Budget tab
- Add budget: Click on this button to add a budget. This opens the edit budget window shown below.
- Delete budget: Select a budget in the list and click on this button to remove the budget for the customer.
- Edit a budget by double clicking on a budget in the list. This will also open the edit budget window (shown below) pre-populated with the budget's current settings, all of which are editable.

Customer budget edit window

- Description: The description for the budget. This is for your reference, only displayed in the budget tab of the customer details window.
- Budget period: The period that the budget applies to. This list contains only the budget periods previously set up using Budgets.
- Amount: The amount of the budget in your local currency
- Additional budget: If checked this tells mSupply that the budget amount is to be considered as an additional amount available only from the part-period in which its effective date falls. For example, if you have a budget of 100,000 which runs from 1st January to 31st December in a given year and is split into 4 part periods and you then have an additional budget amount of 10,000 with an effective date of 30th July, the following budget limits will apply: for the 1st quarter the customer has 25,000 available, the 2nd quarter 50,000 available (25,000 + 25,000 because part period amounts roll over), the 3rd quarter 85,000 available (25,000 + 25,000 + 25,000 + 10,000) and the 4th quarter 110,000 available (25,000 + 25,000 + 25,000 + 10,000 + 25,000).
- Effective date: This field is only visible if the Additional budget checkbox is checked. The date that the budget amount is to be effective from: mSupply applies the additional budget amount to the part period in which this date falls. Note that if part periods are not in use then additional amounts simply add to the total budget available for the whole budget period.
Using the customer budgets feature
The customer invoice window
This is where you see the customer budgets feature doing its job; when you're distributing goods to a customer:
- Create a new customer invoice (Customer > New invoice…)
- Enter the customer name
- Select the budget period that this invoice belongs to from the Period drop down list (this list contains the periods you set up using Budgets).
- If you haven't set up a budget for the customer you are warned with this message: “There is no budget set for this customer in that period. You will not be able to confirm the invoice until the budget has been set.”.
- If you've followed the instructions above and setup the customer's budget correctly then the Total budget used and total budget fields are populated to show you exactly how much of their budget the customer has used so far.
- Add items to the invoice as required.
- Everything will behave exactly as it has done before until the customer's budget amount has been exceeded.
- When the customer's budget has been exceeded (this can be the full period amount or the part-period amount if the part-period limits are turned on) and the confirm button is clicked you will be alerted with the message “This invoice exceeds the budget set for this customer. You cannot confirm it without authorisation (Note: you cannot confirm the invoice at the same time as authorising it, you must save the authorisation first by clicking the OK button, then re-open the invoice and confirm it)”.
- The invoice must now be authorised by a user with suitable permissions before it can be confirmed: See Invoice Authorisation for details on authorising customer invoices.

Reporting on customer budgets
There are several reports that provide various information on customer budgets, they are:
- Disbursement Report - shows items with their values which have been distributed to customers during a budget period.
- Expenditure report - shows spending against budgets with remaining available budget.
- Trend Report - shows, in graph format, spend against budgeted amount.
Disbursement report
- From the Navigator click drop down menu Reports and click option Customer Budgets.
- Choose budget_balances from the print options window which appears:

- Budget period: select the period you want to report on.
Expenditure report
- From the Navigator click drop down menu Reports and click option Customer Budgets.
- Choose budget_district_expenditure (or budget_facility_expenditure) from the print options window which appears:
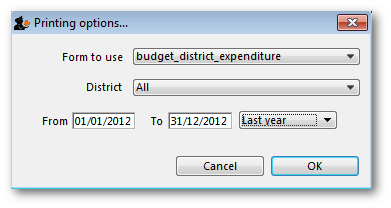

- If District: Select “All” to see expenditure for all districts, or select a district to see expenditure for the facilities in that district
- If Facility: Select the facility to see expenditure for that facility, and select the reporting interval
- Select the date range you want to report on.
Trend report
- From the Navigator click drop down menu Reports and click option Customer Budgets.
- Choose budget_trend_district (or budget_trend_facility) from the print options window which appears:
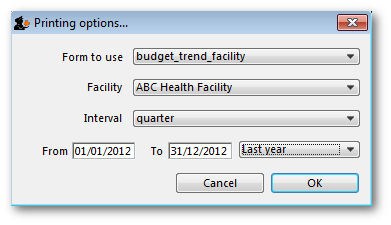

- District/Facility: Select “All” to see a graph for all, or select a district/facility to see a graph for just the selected district/facility
- Interval: Choose the intervals you want for the horizontal axis, eg. quarterly, yearly, etc.
- Select the date range you want to report on.
Note that this is a cumulative report, so the graphs generated need to include the entire budget period. This means that the date range is only used to determine which budget periods intersect with the selected dates e.g. if the date range covers more than one budget period, a graph will be generated for each one.
| Previous: 8.07. Stock control methods for your customers | | Next: 9. Returning goods |