Table of Contents
13.03. Transaction reports
Transaction based reports are accessed by choosing the Report > Transactions… menu item or by clicking on the Transactions item in the Transactions section on the Reports tab of the Navigator:
![]()
All these reports (and there are many!) summarise supplier or customer transactions in many different formats. Many different filters have been incorporated, allowing filtering on transactions, names, prescribers, items, categories and departments. The filters that do not apply to different reports are hidden as required. Feel free to mix and match and experiment with the filters and different reports to see the different views of information that you can get.
The basic sequence for creating a transaction report is this:
- Select the type of report you want from the Type of report list in the top left.
- Select the date range of transactions you want included in the report in the Date range section.
- Select the transaction type you want the report to run over in the Transaction type section.
- Set any other filters/settings you need to refine the contents of the report (Transaction category, Name, Item, Stock, Prescriber filter etc. sections).
- Click on the OK button to run the report - you can select whether you export it to Excel or print it in the next window that opens (well, mostly - some reports are exported to Excel only so you won't have a choice for them).
See below for more in-depth detail on all these steps.
Standard transaction reports
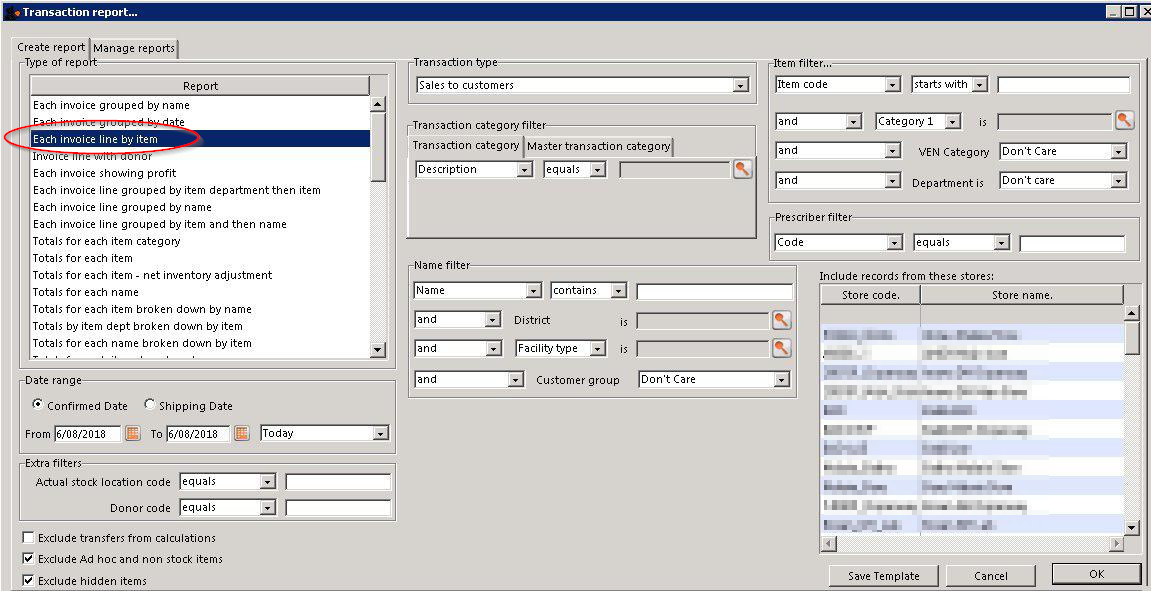
This is the window you will see:
![]()
Type of report
Choose from several formats for displaying transaction information by:
- selecting the report type in the Report list on the left, and
- choosing the required radio button under Transaction type
The following table lists the available report names, and gives brief details of the information provided by each report .
| Report name | What it does | Sample |
|---|---|---|
| Each invoice grouped by name | The report will sort each invoice in the date range according to the name (Supplier or Customer) and give totals for each name. | Sample |
| Each invoice grouped by date | As above, but totals given for each day. | Sample |
| Each invoice line by item | Lists each batch supplied or received, and the transactions for that item. This report can be very long | Sample |
| Invoice line with donor | As above, but including the 'donor' field and formatted to be most useful for analysis using Excel filtering and Pivot Tables. This report can be long. | |
| Each invoice showing profit | The cost and selling price totals for each invoice are displayed. | Sample |
| Each invoice line grouped by item department then item | The invoice lines are grouped by item department assigned to each item. Each item department is then sorted in alphabetical order. Includes batch information. | Sample |
| Each invoice line grouped by name | The value of batches received/supplied from/to each name. Includes batch level information. | Sample |
| Each invoice line grouped by item and then name | Invoice lines are all displayed, grouped by item and then, within those groups, by name. Includes batch information. | Sample |
| Totals for each item category | The total value for each category will be displayed - each transaction will not be shown. | Sample |
| Totals for each item | Each item that has been received (or issued) will be shown with the total quantity and value received/issued | Sample |
| Totals for each item - Net Inventory adjustment | Each item on which an inventory adjustment has been made is shown; the net adjustment is displayed, with both quantity and value shown. | Sample |
| Totals for each name | The invoice lines for the chosen date range are grouped together for each name. This report allows you to see quickly what has been issued to a customer or customers. | Sample |
| Totals for each item broken down by name | Lists all items, showing their distribution to recipient customers or delivering suppliers | Sample |
| Totals for each item dept broken down by item | Sample | |
| Totals for each name broken down by item | As above, but listing customers or suppliers and items received by or delivered by them | Sample |
| Totals for each item department | The total value supplied/received for each item department is shown | Sample |
| Totals for each item grouped by day | The total quantity and value of each item is shown for each day. | Sample |
| Totals for each item grouped by month. | The total quantity and value of each item is shown for each month. | Sample |
| Totals for each item grouped by item description. | First the report is sorted by item then the total quantity and price of each item is shown. It also provides a grand total for the item quantity and price columns. | Sample |
| 2 period comparison by item category | User selects two periods, and the transactions for each period form a column. The rows are determined by the item category. This is a special report that has different input options. See entry below. | |
| Totals for each item broken down by packsize | The packsize for each item and the number of packs issued. | Sample |
| Prescription and general issues over time | This report shows the quanity of items given to patients and other customers over a period of time, separated by month. It exports to Excel only and has 2 tabs; the By Item tab shows which prescribers prescribed what items and the By Customer tab shows which items were issued to which customers | Sample |
| Prescriber report | This report allows you to view the total value, mean item value and item count for prescriptions dispensed for each prescriber | Sample |
| Dispensing with patient name and prescriber | This report shows who dispensed what to which patients with which directions | Sample |
| Historic prices - Volume weight average price | This report produces a volume weighted average price for all transactions within the specified time period, for items that are On the price list in the store that you are logged in to. Transactions that have have no transactions or a Cost price of 0 are ignored.Calculations are done on the basis of the Catalogue pack size (often be the same as the Preferred pack size). That is, transactions that are not in the Catalogue pack size will have their calculation adjusted accordingly. | |
| Cross tab: items in rows, names in columns, quantity in cells | These reports are like Excel pivot tables. Warning: they can be slow to produce if you have a lot of data. Start with small date ranges until you are comfortable your machine can handle the load. Note that reports that produce a lot of columns won't print well - it is better to export them to a spreadsheet and print from there. | Sample |
| Cross tab: items in rows, names in columns, value in cells | See above | Sample |
| Cross tab: items in rows, days in columns, quantity in cells | See above | Sample |
| Cross tab: items in rows, days in columns, value in cells | See above | Sample |
| Cross tab: items in rows, months in columns, quantity in cells | See above | Sample |
| Cross tab: items in rows, months in columns, value in cells | See above | Sample |
| Cross tab: names in rows, months in columns, quantity in cells | See above | Sample |
| Cross tab: names in rows, months in columns, value in cells | See above | Sample |
| Distribution of quantities issued | First the report is grouped by item name and then by the pack size issued. It displays the total quantity and total count for each item. | Sample |
| Totals for each item grouped by transaction category then item | The report is grouped by each item's transaction category first and then by each item.The report shows the total count, total quantity and total value for each item. Lastly it also calculates a grand total of the items count, quantity and value columns. | Sample |
| Each invoice sorted by Name >Address1 field then by name | The invoices are firstly sorted by the address1 field, and then by the name they were supplied to. This groups invoices together by whatever you entered in the “Address1” field for each name - e.g. you might enter the region or province. | Sample |
| Each invoice sorted byName >Address2 field then by name | As above, but the first sort is by the entry in “Address2” field. | Sample |
| Customer ordered short fall report | Where there has been a shortfall, this report shows the shortfall of each item and of each item category by quantity and percentage. It shows what demand from customers has been met and what has not. It applies only for issues to customers. | Sample |
| Customer transaction report 1 | This report and the following three are, in fact, templates, and are the starting point for designing reports on specific criteria not covered in any of the existing reports. | Sample |
| Customer transaction report 2 | Sample | |
| Customer trans line report 1 | Sample | |
| Customer trans line report 2 | Sample | |
| Received vs. sent | Shows the difference between stock issues from a supplier and stock receipts for the same lines at the customer. If you choose Purchases from suppliers as the Transaction type then the report will run over supplier invoices and show differences between what the current store was sent from the supplying store (on customer invoices) and what the current store received on the corresponding supplier invoices. If you choose Sales to customers as the Transaction type then the report will run over customer invoices and show differences between what was sent from the current store (on customer invoices) and what was received on the corresponding supplier invoices in the receiving store. WARNING: any non stock-transfer transactions included in the report (if you select Normal transactions or Both normal transactions and stock transfers in the Transaction type section) will show a full difference because there is no corresponding customer or supplier invoice. So it is recommended to only choose the Stock transfers option in the Transaction type section for this report. | received_v_sent.pdf |
| Months to expiry | Sample | |
| Order processing time | If you are filling out the order written date and order received date for incoming customer orders, then this report will show you how long it is taking for orders to reach the store, and how long it is taking to process orders from receipt to order entry and to order dispatch | |
| Historic prices - Volume weighted average price | Calculates the Volume weighted average price for all items in the catalogue in those stores (i.e. where the item's On price list checkbox is ticked (see the 4.01.03. Items - Misc(ellaneous) tab page for details)) for all confirmed or finalised supplier invoices within dates provided by the user for all selected stores. Please note: * Transactions where the stock has a cost price = 0 will not be included in the calculation.* Items that have had no transactions within the selected period will not appear in the report. * The On price list checkbox must be set for each store. This will be important if you're running the report over more than one store. |
Transaction type
In the first drop down list, you can choose to report on:
- Sales to customers: customer invoices i.e. transactions of type ci
- Sales to and credits from customers: customer invoices & customer credits i.e ci and cc transaction types
- Purchases from suppliers: supplier invoices i.e. transactions of type si
- Purchases from and credits to suppliers: supplier invoices & supplier credits i.e. si and sc transaction types
- Inventory adjustment - Add stock: All inventory adjustment transactions that resulted in stock additions (e.g. when you did a stock take of an item and counted more on the shelf than the total shown in mSupply).
- Inventory adjustment - Reduce stock: All inventory adjustment transactions that resulted in stock reductions (e.g. discarding stock due to it being expired). Note that using a report that shows the total for each transaction category can give totals for expired/damaged etc.
- Inventory adjustment - Net movement: Taking into account both reductions and additions, the nett change in inventory due to adjustment transactions.
- Customer invoice cancellations: These are the “inverse” invoices created when a customer invoice is cancelled
- Credits to customers: The credits applied to customers when invoices are cancelled or when goods are returned.
- Payment cancellations: The “inverse” payments created to reverse a payment made by a customer for a customer invoice that has a payment against it and has been cancelled.
In the second drop down list, you have the following options:
- Both normal transactions and stock transfers: this is the default option and means that both stock transfer and non-stock transfer transactions will be included in the report
- Normal transactions: all transactions that are not stock transfers will be included in the report
- Stock transfers: only stock transfers will be included in the report
A stock transfer is a transaction made when the supplier or customer is another store in your datafile. A normal transaction is when the customer or supplier is a normal customer or supplier in your datafile, and not a store.
Date range
Enter the date range of transactions to report on, having selected Confirmed date or Shipping date. Note that the date used may differ from the original entry date, depending on how your system is configured in the Preferences.
- Note the popup menu to the right of the date entry fields that allows you to choose quickly from a list of common date ranges:

- Note that “last year” refers to the year preceding the current year (that is, if the current year is 2012, choosing “last year” will set the dates from 1st Jan 2011 to 31st Dec 2011).
Transaction category filter
Assuming you have set up transaction categories, your report may be filtered by category. For help setting up Transaction categories click see sectrion 22.07. Transaction categories.
- Transaction source: Options are “All”, “Customers, Suppliers and Stores” or “Patients”. This allows you to select the type of Name the transactions must belong to. If you select Patients, only transactions which have a name that is a patient will be inccluded in the results (e.g. prescriptions). If you select Customers, Suppliers and Stores then transactions that have a name which is a normal supplier (e.g. supplier invoice) or customer (e.g. customer invoice) or store (e.g. stock transfer) will be included in the report. If you select All then this filter is effectively not used and transactions with any name type are included in the report.
- Transaction category: Use the magnifying glass to choose the transactions categories to be included in the report. Note that you can select more than one category. The types of categories offered in the list will match your selection in the Transaction type section.
- Master transaction category: If you prefer, you can choose to filter by master transaction category instead. Master transaction categories are used to group together transaction categories (so selecting one of these is like selecting multiple categories in the Transaction category filter - it's just more convenient to do it this way if you regularly need to choose several. We love to make things easier for you!). Again, see 22.07. Transaction categories for details on setting them up.
Name filter
You can enter a particular customer code or category of transactions to be displayed.
- You can choose from either equals for an exact match or starts with to search for all names whose code or category starts with the entered text.
- Each name has 6 different categories that can be used to group certain kinds of names together. You can filter on category 1 (which is hierarchical) using the Category 1 filter in the screenshot at the top of the page (note that the Category 1 text will be replaced with any name you have assigned to this category in the preferences) and one of the other categories using the Category 2 filter shown in the screenshot at the top of the page.
- If you want to report on transactions for a single name, you can find their code by looking up their details using Supplier > Show suppliers or Customer > Show customers.
- There is also a Customer group filter you can use to include names based on their customer group.
Item filter
Here you can specify the items to include in the report.
Note that sometimes the item choice options will be hidden because the chosen report is reporting on transactions, not on transaction lines:
![]()
Donor filter
If you have donor tracking turned on in the preferences, and choose a report that bases it's data on invoice lines, then you will be given the option to filter the report for a particular donor or group of donors.
Which mode?
If you are using mSupply in both store and dispensary mode, you might want to report only on transactions in store mode (items distributed to customers) or in dispensary mode (items distributed to patients). You can do this by checking Store mode or Dispensary mode radio button depending on your requirements.
Exclude transfers from calculations
This checkbox enables you to choose whether you include stock transfers (where stock is transferred from one store to another in mSupply) in the report calculations. If you want stock transfers to be included in your report then uncheck this checkbox. If you want stock transfers to be left out of the report then check this checkbox.
Excluding transfers is only really useful if mSupply is being used in your central and regional warehouses (between which 'transfers' are happening, and none of your customers of interest are using mSupply.
The 2 period comparison by item category report
This report allows you quickly to compare sales or purchases for 2 periods of your choice based on item categories.
When you choose this report a different set of options is shown.
![]()
Set the date range for each of the columns and then choose a summary level. It should be noted that if no data is present for the first period defined, this report will not run.
Dot notation and summary levels
The summary level is based on the item category field. If you have set up item categories using dot notation, then you can summarise categories.
To set up item categories, choose Items > Show item categories
Take the following simple example of categories that have been set up as follows:

The rules for dot notation are
- Separate each level of your hierarchy with a period (dot).
- Within a level you can have as many characters as you like
- You can use any characters, as long as you don't use a period or a space within one level; e.g. “surgical.gloves.small” is a valid entry. (Level one is “surgical”, level two is “gloves” etc.).
- When the hierarchy part of the category name is finished enter a space character. You can then enter a description for that level of the hierarchy.
If we run the report with a summary level of “none” each category is shown
![]()
If we run the same report with level one chosen, only the first level of the hierarchy is shown. Items with categories 1.1 and 1.2 and 1.1.1 have all been summarised under “1 Antibiotics”
![]()
And with level two chosen, items with category 1.1.1 and 1.1.2 are summarised under the heading “1.1 Penicillins”
![]()
Note that if you have items to which no category has been assigned, they are shown under the heading `none“ at the top of the report.
The categories are printed in the order that you have specified by drag-and-dropping in the window shown by choosing Item > Show item categories….
Transaction filter: Filters the report for given category
Prescriber filter: Reduces the found transactions to those for the given prescriber only, depending upon the selection made (equals, starts with, contains, is not equal to).
- Obviously only useful in dispensary mode.
Exclude transfers from calculations: The check-box Exclude transfers from calculations when checked will ignore transfers between stores within the organisation.
Exclude Ad Hoc and non stock items: The check-box Exclude Ad hoc and non stock items is displayed accordng to the type of report selected. By default, it is checked.
When checked, the transaction report generated will not include any Ad Hoc items or non stock items (items you don't normally keep in stock).
Custom transaction and trans lines reports
These four reports should be regarded as templates for you to design your own report .
Having decided whether you wish to report on transactions or transaction lines, you need to design the report according to your specific needs. Coose Reports > Manage Reports :
You are presented with the Report management window. In this example, our report will be on transactions, so you should highlight custom_transaction_report_1 , and click onthe Duplicate report button:

Choose an appropriate name for your report, and any comment you wish, and click OK. You are returned to the Report management window, where you should scroll down until you reach the report you have created; note that the name you gave the report will appear in the Custom name column; highlight the row and click Edit report .

This brings up the Edit report window. Creating custom reports is described in detail earlier in this chapter. See the Custom Reporting Tutorial
Save template button
The save template button allows you to save a given report as a template once you have input your chosen settings. Templates can be reused as needed.
Pressing the Save Template button brings up the following window:

This dialog allows you to set a name and description for the report template. You can also define user permissions: at the moment, you can define these as ‘Public’ - for anyone, or ‘Private’, in which case the permissions only apply to the user who created the template.
- View Preferences: define which stores will be able to view and use the template on the ‘Manage Reports’ tab (next screenshot).
- Edit Preferences: define which stores will be able to edit or delete templates on the ‘Manage Reports’ tab.

- Displays all template reports that the user has permissions to view.
- Allows user to use the template:
- Redirects user to ‘Create Report’ tab
- Settings here will be set according to the preferences of the template report
- Users can also edit, delete, and duplicate the reports if user permissions allow.
- Duplicated reports will be named ‘ReportName[duplicate]’
- Quick search searches in all text columns of the table.
Pivot table friendly transaction report
There is an almost infinite range of reports that you might want to generate from transaction data. If you are comfortable using Excel Pivot tables, there is an mSupply transaction report format that you will likely find quite useful. This report has been designed to work in Supervisor Mode but will also work in a single store.
To generate it:
- click on Reports > Transaction
- After configuring the various date range, Item, Name, transaction type, etc. filters
- Select the Each Invoice Line by Item report in the top left
- Then, select
CustomTransactionByItemreport type and send the output to Open in Excel

![]()
The report will open in Excel in a form that can then be easily filtered, sorted and manipulated through a Pivot table. If fact, the records are not sorted at all, so they must be processed to make any sense!
| Previous: 13.02. Stock and items reports | | Next: 13.04. Purchasing reports |