20.08. Statistics
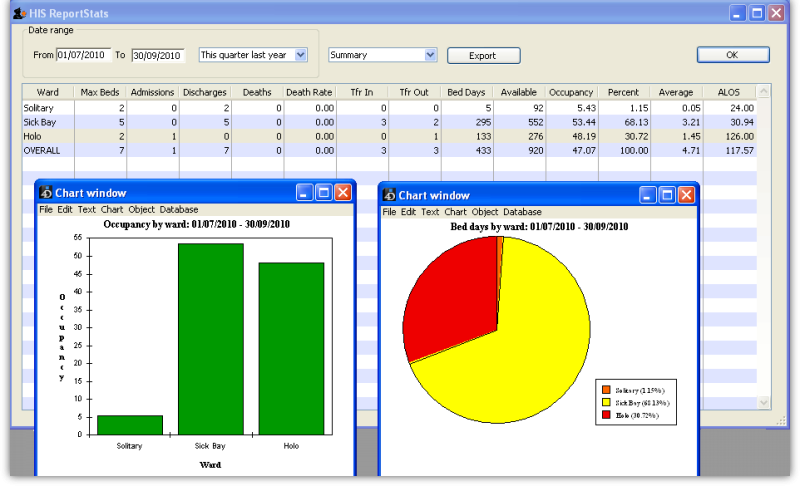
Select Reports > HIS Statistics to bring up the statistics window.
You can select a time period from the date range pull-down menu or enter specific dates. By default, the summary statistics page is shown. A bar chart by ward for any column (except the first) can be generated by holding down the SHIFT key while clicking on any of the cells belonging to that column. If you prefer a pie chart, hold down CTRL instead of SHIFT.
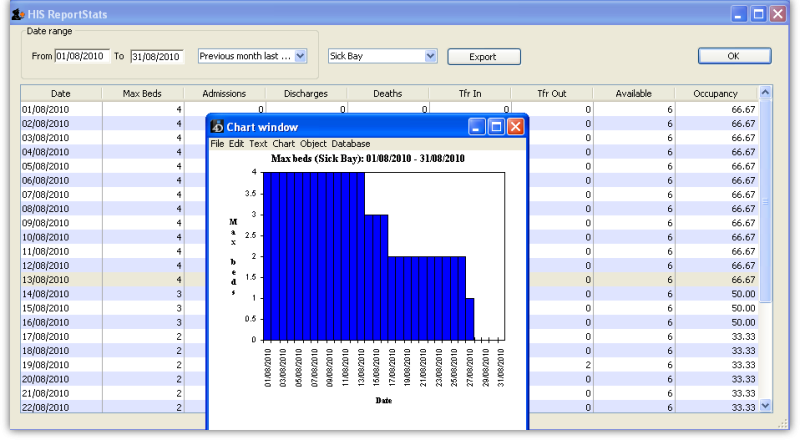
If any of the individual wards are selected from the pull-down menu (instead of “Summary”), then it displays the data for that ward on a daily basis. In this case, a bar chart for any column (except the first) can be generated by holding down the SHIFT key while clicking on any of the cells belonging to that column.
In either mode, the displayed columns can be exported as a tab-delimited text file (which can then be imported into Excel or other spreadsheet application) by clicking on the Export button.
| Previous: 20.07. Other lists | | Next: 20.09. HIS preferences |

