13.04. Purchasing reports
Purchasing reports (focused on what you have ordered and what you have received and what you want to order) are available at Report > Purchasing. The following report types are available:
The first 2 options contain several different reports (see below). Select the required report type by clicking on it.
Purchase orders
Types of report
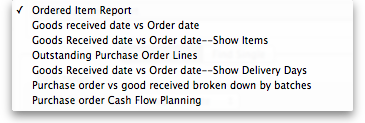
There are seven reports currently available:
- The Ordered Item Report will list items that are on Purchase Orders according to criteria specified.
- The Goods Received date vs Order date report lists each Goods Receipt for a particular Purchase Order and the number of lines received, then follows with details of the number of lines and date of the original Purchase Order, as in the example below. This is useful for tracking supplier delivery performance.
Note that the number of lines received may not match the number ordered as a single Purchase Order line may be supplied in split deliveries, as in example shown, or an ordered line may not be supplied at all.
- The Goods Received date vs Order date - Show items report.
- The Outstanding Purchase Order Lines report, which will display all Purchase Order lines for Purchase Orders provided that
(1.) delivery is incomplete, and
(2.) the Purchase Order has a Confirmed (“cn”) status. - Note that Purchase Orders whose status is Finalised (“fn”) will be ignored when producing this particular report.
- The Goods Received date vs Order date - show Delivery days report shows the number of days taken to deliver items.
- The Purchase order vs goods received broken down by batches report shows the dates particular batches were received.
- The Purchase order cashflow planning report shows you the values and times of expected deliveries so that you can plan when money needs to be available to pay for them.
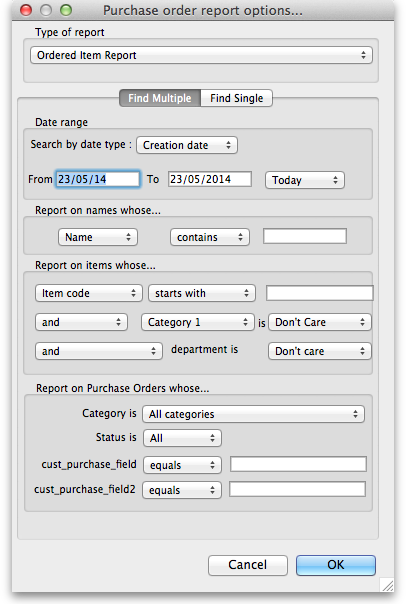
Date range and date type
A date option, for selecting which items/purchase orders to include in the report must be selected; options are:
- creation date - the date purchase orders were created
- sent date - the date purchase orders were confirmed
- expected delivery - the expected date of delivery for items
- actual delivery - the actual date that items were delivered
The report will include items/purchase orders with the selected type of date falling between two specified dates entered in the From and To fields. The drop-down list on the right affords many quick-choose preset date range options such as “today”, “yesterday”, “this week”, “last week”, “this month” etc.
Report on names...
The report may be confined to suppliers meeting specific criteria by selecting one of several supplier properties (“Name”, “Name code”, “analysis”, “category”, “Price code” etc.) in the left dropdown list, “equals”, “starts with” or “contains” in the centre dropdown list and making an appropriate entry in the field on the right. If this field is left blank, the report will include purchase orders from all suppliers within the chosen date range.
Report on items...
Similarly the report may be confined to items meeting specific criteria; you choose an item's property to filter on in the left dropdown list followed by the comparator in the centre dropdown list and finally making an appropriate entry is made in the field on the right. Again, leaving this field blank will produce a report on all items within the chosen date range.
You can also report on items that have a certain category and/or department. By default these options are set to “Don't care”, which means the item categories and departments will be ignored.
Note that only reports that report on invoice lines will produce meaningful results when you choose item criteria. Reports that report on whole transactions (e.g. “Each invoice grouped by name” or “Each invoice grouped by date”) will not produce meaningful data, as any one invoice can contain multiple items. Choose reports that report on invoice lines (e.g. “Each invoice line by item” or “Totals for each item grouped by month”) for these filters to have an effect.
Report on purchase orders...
In the same way, you can also filter your reports on properties of the purchase orders involved: category, status and both purchase order custom fields. For more information on purchase order categories see here.
Please note there is also a Purchases by suppliers report that relates stock received to purchase orders made. This is one of the item ledger type reports and details can be foiund on the 13.02. Stock and items reports page.
Purchases
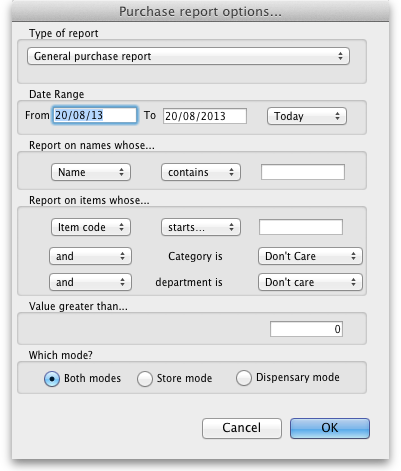
This report finds all purchasing transactions over a certain value within a specified time period
You should enter:
- The date range of transactions on which to report
- Four filters are available to refine the report - a name filter, and three item filters; all are optionally and will be ignored if nothing is entered in the textbox or drop down lists are left at “Don't care”.
- The value of a transaction line above which the report will cover.
It may be good for your organisation to have a purchasing policy that stipulates that transactions over a certain value must be authorised by a second party (that is, someone other than the purchaser). This report allows you to monitor such a policy easily.
Suggested order quantities
Use this report for mSupply to analyse your current stock and, based upon a required number of months of stock cover which you enter, suggest how much of each stock item you should consider ordering.
There are currently 3 options for the suggested order quantities report: Suggested ordering report, Suggested order quantities with prices and price extension (see below for details on this report and its additional option) and Suggested ordering [Excel] report. They all have the same options as defined below but the last two will run much more quickly than the first one, even if the first one is exported to Excel. This is a temporary situation: the first option will be removed in a later version of mSupply and the last two will be the only options available.
Quantification
Some logic behind the calculations involved in this report is described in detail on the 6.01. Ordering stock from suppliers page.
As of version 7.15, mSupply supports a wide array of options for calculating forecast Average Monthly Consumption (AMC), which is then used to forecast needs and then to calculate a requested order quantity.
The options are:
Don't Adjust AMC
This has been the default in mSupply up until this point. The historic consumption is summed up for the number of months specified in the lookback field, and divided by the number of months. This works well if the item was fully stocked for the whole time. This method results in the forecast AMC being too low if stock was low or zero in the past.
Consumption vs Distribution vs Issuance: Stock may be consumed within the facility for the care of patients, or distributed to other facilities, but for the purposes of the supply chain, whatever a store issues out of stock is 'consumption', and these terms all have the same meaning. In mSupply, we use the term Consumption.
Adjust by % of days out of stock
This method takes each historic month's consumption, and adjusts it for the number of days in the month the item was out of stock. We multiply the consumption for the month by (Days in month divided by Days in stock) to get an Adjusted AMC Take this example for a single month where Item B had nil stock for a period of time:
- Item B was in stock for 10 days in the month
- Its historic consumption was 500
- The adjusted AMC is 500 x 31 / 10 = 1,550
Only consider fully stocked months
Here, we are attempting to address months with low stock by excluding them from our calculations, rather than adjusting their consumption.
There is a field shown % of days in stock to be considered fully stocked that defaults to 90%
For this method to work, you need to set the lookback period long enough that mSupply will be able to find enough fully stocked months to run the calculation. You can also include more low stock months by setting the % of days in stock to be considered fully stocked field to say) 50%. Do this with caution, as there is a real danger that it will result in an underestimate of AMC.
mSupply's better algorithm
We've tried to come up with a better algorithm here by:
- ignoring months that are in stock for < 33% of days. That is, if the item was in stock for less than 10 days in the month, the consumption on those days is too erratic to draw conclusions about what the consumption for the whole month would have been.
- For months with stock >= 33% of days, Multiply the consumption for the month by √(Days in month/Days in stock) to get adjusted AMC. This adjusts the consumption up due to being out of stock, but by a factor up to 1.7 - so not as big an adjustment as the “Adjust by % of days out of stock” method.
- We also ignore months where the mean stock on hand is less than “% of typical AMC that stock level is considered compromised:” value you enter. This is a bit complicated, but here's an example:
- Consider Item A - we have set the “when we calculate consumption there are 3 months that were “fully stocked” - those three months give us an AMC of 1500 per month.
- Now, there's another month that was fully stocked (as in, on all 31 days in the month, there was some stock on hand.
- But it turns out that the average stock on hand was only 50 - clearly they could never have had “normal” consumption, although they did have stock - if the cut-off is set to 100%, we're saying “ignore this month unless the average stock on hand was 1500 - in this case it's 50, so this month isn't used in the AMC calculations
We then sum the adjusted consumption for all the eligible months & divide by the number eligible months to get the best forecast AMC eva 
Here's a diagram:
Let's take an example of how this is done:
Lets say we are using:
Step 1: First we are adjusting by % days in stock to be considered fully stocked. This calculation will be used in Step 2 to calculate the typical AMC. So if this is set as 90%, only months with ≥90% stock will be considered. In this case, Nov 2023 (202311) and Oct 2023 (202310) are excluded as it is less than 90%.
Step 2: We then calculate the typical AMC which excludes the months Nov 2023 (202311) and Oct 2023 (202310) from step 1. To do this, we use: (Total consumption of only months included in Step 1)/(Number months usage basis) = 100 / 7.8 = 12.82. Red coloured boxes indicate exclusion. (Note: We have 7 full months, and 0.8 of a month due to July 2024 (202407) as 26 days is 0.8.
Step 3: Next there is an automatic exclusion for days of low stock ≥33% in the month. Note: This is automatic and is not set by the user. In the example, this is Nov 2023 (202311) as it is the only month with less than 33% days in stock in the month.
Step 4: Now we consider the criteria of “100% of typical AMC that stock level is considered compromised” which we entered in the Report options. Since this is set as 100% by us, we now take the typical AMC (12.82) and check the Mean SOH of each month to make sure that this is equal or higher than 12.82. If stock level is not higher than 12.82, that month will be excluded from the Adjusted AMC calculation (Step 5). Note: If we had selected 90% of typical AMC to be considered compromised, this means we will be looking at 90% stock or more of the typical AMC (12.82) and anything less than this will be excluded.
To now obtain the number of months to be considered for the adjusted AMC: We will exclude the 33% low stock month from Step 3. We will exclude any months with (x)% typical AMC stock level that is considered compromised (which in this case, there is none). We will be including the month with 11 days in stock however, as it is more than the 33% exclusion step and the first step where it was excluded was just for calculating what months to use for typical AMC.
From the example, we will now have 8.8 months that we will be considering for the Adjusted AMC.
Step 5: We can now calculate the Adjusted AMC with the formula: Square root[(Days in month)/(Days in the stock)] * Consumption We check this individually for each month that has not been excluded. So, if the “Days in month” = “Days in Stock”, the square root of this = 1. In Dec 2023 (202312) = 1 x 100 (consumption) = 100. In Oct 2023 (202310) = Squareroot(31/11) = 1.6787. Then 1.6787 x 100 (consumption) = 167.87.
Add these together: 100 + 167.87 = 267.87 total for all included months that we will use to calculate adjusted AMC.
Step 6: For the Adjusted AMC = 267.87/8.8 months = 30.34 units per month.
Steps Summarised:
Step 1: Adjusting by % Days in Stock
- Set threshold for fully stocked (e.g., 90%)
- Exclude months with < 90% stock
Step 2: Calculate Typical AMC
- Use months not excluded in Step 1
- Calculate Typical AMC = (Total consumption of only months included in Step 1)/(Number months usage basis)
Step 3: Automatic Exclusion for Low Stock
- Exclude months with < 33% days in stock
Step 4: Compromised Stock Level Check
- Set threshold (e.g., 100% of typical AMC)
- Exclude months below threshold
Step 5: Calculate Adjusted AMC
- Apply formula to each included month = Square root[(Days in month)/(Days in stock)] * Consumption
- Sum the results
Step 6: Final Adjusted AMC Calculation
- Divide total consumption by number of months
- Calculate Adjusted AMC
Note: If all months have been excluded due to the first or second exclusion criteria, then the typical AMC calculation will automatically be used instead.
Report options
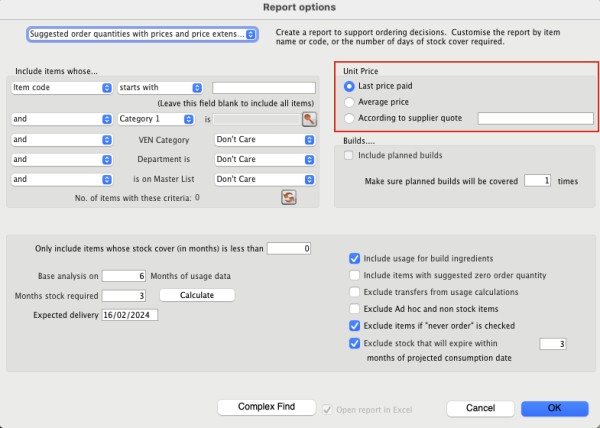
You'll see this window:
If you want to report on all items, leave the item name field blank, otherwise enter an item name or code. For example, to report on amoxycillin stocks, you could enter “amox” into the field.
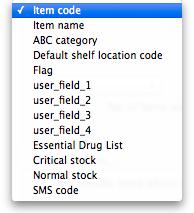 The drop down list, after the item name and code choices, lists several other fields, including any user defined fields, where the names that you have defined for custom item fields in the Preferences are displayed.
If you wish to use item categories, then use the Item category list to choose the one on which you want to report.
You can use the drop-down list to find Items with a particular code, or to use the values you have entered into one of the custom user fields. If this isn't powerful enough, use the Complex Find button to display the full query editor.
Click on the refresh button (double orange arrows) to show the number of items these basic parameters will find.
Only include items whose stock cover is less than…: If you want to report only on items whose stock is low, enter the threshold for days of stock on hand into the second field. For example, entering 90 into this field will only include items in the report whose stock is not sufficient to cover average usage for the next 90 days.
Enter “0” (zero) for this field to report on items with any amount of stock remaining.
Expected delivery: Enter an appropriate date that you expect the stock to arrive with you based on previous delivery times.
Include usage for build ingredients: If you manufacture items, you can choose whether the use of ingredient lines in manufacturing is included in the report or not.
Basis of analysis: Enter the number of months of data (form the current date) mSupply should use to calculate your consumption.
Exclude transfers from calculations: Check this box if you wish transfers within your organisation to be excluded from the calculations.
Include items with no usage in the last 12 months: If this box is checked, items which have not been used over the last year will be included. This check box will have no effect if the previous “days cover” field is filled in, as an item with no usage will have “infinite” cover- any stock you do have is going to last you forever
Months stock required: In this field, enter the number of months stock cover you want to have available. The report will automatically take into account any stock you already have, so all you need to do is enter how many months cover you want.
AMC Adjustment for Out of Stock: See the “Quantification” discussion above on the different options available.
Exclude stock that will expire within 3 months of projected consumption date a checkbox that allows you to accurately predict the amount of stock that is likely to be wasted due to expiry and current consumption rate. In this current example, mSupply will only aim to distribute stock if the expiry is more than 3 months away. This updated feature is only available in mSupply v7.12 or later.
This topic is huge so it may be worth reading this topic Stock wastage prediction for ordering
Open report in Excel: Checking this box opens Excel (or any other installed spreadsheet application) and displays the report as a spreadsheet. If you want to save the report, choose File > Save as… in your spreadsheet application.
Report output
A typical `Suggested Order` report will look something like below.
Definitions of each column after item properties:
- Stock on hand : Total quantity of stock currently available in your inventory
- Expiring stock : Calculated by (Total stock that is set to expire) - (Daily stock usage [which is derived from the AMC e.g., AMC / 30 days if 30 days in the month]). The amount of expiring stock to be accounted for is selected in the reports option:
- Effective SOH : Calculated by ('Stock on hand') - ('Expiring stock'). This is the usable stock available.
- Backorder : Quantity of stock that has been ordered by customers but not yet fulfilled due to insufficient stock.
- Stock on order : Quantity of stock that has been ordered from suppliers and is expected to arrive but not yet received.
- AMC 12 months : Average quantity of stock used per month over the last 12 months.
- AMC 24 months: Average quantity of stock used per month over the last 24 months.
- Monthly usage for the last (x) months : Calculated by ('Total consumption for the last (x) months of usage data') / ('(x) months of usage data'). This value is set by the user in the Report options:
- Number of months considered for adjusted AMC : After the AMC adjustment is made (and months with low stock has been excluded), this value indicates the number of months that have been included for calculating the adjusted AMC. This value is derived from whichever formula has been chosen in the “AMC Adjustment for out of stock”:
- Adjusted AMC : This adjusted value is based on the formula selected in the Report options:
- Number of months in stock : Calculated by ('Effective SOH') / ('Adjusted AMC'). This gives the number of months the current stock will last based on adjusted consumption rates.
- Ordered Quantity used : This is how much of the stock you have ordered that you will actually need to use, based on how much you use each day and how much stock you already have (Note: forecast calculation will affect this). This is determined by:
- Calculate the “usage per day of stock” = AMC / 30.4375
- Multiply “usage per day of stock” with the “total number of days in your months stock required” to get “Total usage required” = Usage per day of stock x Total number of days in your months stock required
- Calculate your “Future stock on hand” = Stock on order + Effective SOH - Backorder
- Subtract “Total usage required” from “Future stock on hand” to get the “Net stock difference to be used” = Total usage required - Future stock on hand.
- This value (“Net stock difference to be used”) now determines the “Ordered Quantity used”.
- If the value is a negative value and there is “Stock on order”, add the “Net stock difference to be used” with “Stock on order” = “Net stock difference to be used” + “Stock on order”
- If the value is a positive value and there is “Stock on order”, if “Net stock difference to be used” is greater than “Stock on order”, the “Ordered Quantity used” will be the same value as the “Stock on order” as all the stock on order will be used up.
- Suggested Order calculated by:
- If expected delivery date has not been adjusted: ('Months stock required' x 'Adjusted AMC') - ('Effective SOH' - 'Stock on order') + 'Backorder'.
- If expected delivery date has been adjusted, this will be accounted for as it will only look at the stock required from date of expected delivery to the end of months stock required:
- Usage per day = Adjusted AMC/30.4375 (which is from 365.25/12 which is days in the full year)
- Suggested order quantity = Usage per day x Days needed (which is 'Expected delivery date' - End date of the 'Months stock required', or days needed in total - days of lead time) - ('Effective SOH' - 'Stock on order') + 'Backorder'
- This determines the quantity of stock that needs to be ordered to maintain the desired inventory levels after considering current stock, back orders, and stock already on order.
- Note: if you are using the “Minimum stock” function, the suggested order will also take this into account to ensure that there is enough stock to meet this value. This will be calculated by taking the minimum pack size to cover the minimum stock.
- Note: if you are using forecasting this can affect suggested order quantity. Please check forecasting settings on mSupply if it is indicated as being used in the spreadsheet.
- Note: The “maximum” quantity field is only a UI feature and does not have any other functionality apart from allowing users to see their recorded maximum quantity. Anything in this field will not be accounted for in the SOQ report.
- Forecast used : Based on forecasting options under “Usage” in “Item details” if this has been used or not (yes / no):
For a more detail guide click on this topic : Stock wastage prediction for ordering.
Suggest order quantities with prices and price extension
This report is an extension of the previous one, allowing you to see what the suggested order will cost. The filter choices you have are the same as for the suggested order quantities report but you get an additional option to say how your suggested order will be priced:
Key Columns in the report output:
- Unit Price: Calculated via the latest price or by supplier quotes or using average prices received during the look back period. The `look back period` is the same setting that is used to calculate average monthly stock usages.
- Price extension (Suggested): This is the predicted cost of a future order based on Unit Price.
- Annual consumption (quantity): This is the predicted stock usage over a year based on the latest average monthly consumption.
- Annual consumption (cost): Potential annual cost based on unit price.
| Previous: 13.03. Transaction reports | | Next: 13.05. Stocktake reports |

