Table of Contents
13.02. Stock and items reports
When Reports > Items and Stock is chosen, a range of available reports are displayed; click on the one you require to select it:

Current stock

A report will be produced that lists each stock line that is currently showing stock greater than zero. Should you wish the report to include items/batches with zero stock, the box in the lower left needs to be checked.
Item filter
A “Item filter” allows you to enter the normal find item filter criteria to choose which items to include.
Random
A 'Randomly' filter allows you to enter a number of items that will be randomly chosen, and stocktake sheets for those items printed. This facilitates spot checking of your actual stock situation.
Additional options
Should you wish the report to be department specific, then that department should be selected from the drop down list of the departments which you have created.
Should you wish the report to give information on a particular location, then that location should be specified , selecting the appropriate operator of the three available in the drop down box alongside the Filter by actual stock location option.
Report format
You can choose from three formats:
- “Each batch shown separately” will also give you a column on the right where, having done a physical stocktake, you can enter the quantity that is actually in stock, allowing any corrections to be made in mSupply.
- “Total stock for each item” will not show individual batches, but the total quantity on hand of each item.
- “Each batch with prices” List the price of each batch in stock, with a total at the end of the report.
- “Donor reporting” select this to see donor information - see the 'Donor reporting' section below.
- “Items in rows, Donors in columns” shows eaxactly what it says in the report!
- “Items in rows, Stores in columns” shows a row for each with columns for each store. The cells contain the number of units of the item in each store. Must be run in supervisor mode (see the 26.01. Miscellaneous topics page for details).
The lines are reported alphabetically either by item name or shelf location, depending on what you have chosen in the “Sort report by” options
Donor reporting
mSupply provides the feature of printing the Donor name on the Current Stock report so that organisation donating the goods can be identified and tracked.

Stock on date
This report allows you to produce a report for the stock in your store on a particular date. The stock shown will be the stock at the END of the day. If you want to see the stock at the beginning of the day, choose the day before in the date selector.
You are shown a window like this:

Enter the date for which you wish to show the stock for.
Type of report
You have 3 options:
- Show items only: each item in your system will have a single entry with the total quantity on that date.
- Show items with batches: each batch, its expiry and batch number along with the quantity of stock will be shown.
- Show batches with summary: as 2, but every item has an aggregate line before the lines for each batch, showing the total quantity for all batches of the item. So it's a bit like a combination of 1 and 2.
- Monthly stock & consumption history (Excel): Each item has 3 rows showing its consumption, days it was in stock and its mean stock on hand for each month from the current month to the number of months in the past selected in the Months to look back field.
The Report on items whose box allows you to restrict the report to certain items only, using item properties or different categories as filters.
If custom stock fields are set to be used in the datafile then they will also be shown in filters beneath the item filters.
Open report in Excel
Check this checkbox to view the report directly in your chosen Spreadsheet program.
Show total stock value

This report is used to find the total stock value either for a particular department or all departments. The drop down menus allow customisation of your report by entering appropriate search criteria from the many options.
Check this checkbox to directly open the report in Excel rather than printing.
Graph: stock by item
This report shows a graph for an item or items showing the quantity of stock on hand for each day over a defined period.
Note that if you have allowed editing of confirm dates on transactions, mSupply's ability to calculate accurately the data used in this report may be affected.
Choosing this item from the menu displays this window:

Enter the date range, or select the required period from the drop down list, the items on which you wish to report, and appropriate filters, if any. Remember you can use the item flag field to select an ad hoc list of items to include in your report.
Clicking OK displays a window where you are shown a graph of the quantity in stock on each day for the first item that matched the criteria you entered.

This window also displays a list of items that were found. To display the graph for a different item, choose it from the list.
This report can be used as one of a set of key indicators for performance of a facility by comparing days out-of-stock of key items from one year to the next.
Graph: total stock
The total stock graph report allows you to view the value of your stock over a desired period of time. When you choose total stock graph, you are able to enter the required period which you would like to view:
Select OK and a graphical stock history report showing stock value will be displayed

Item list

This report allows you to print a list of you items in certain formats.
There are 3 options in the Report form to use drop down list:
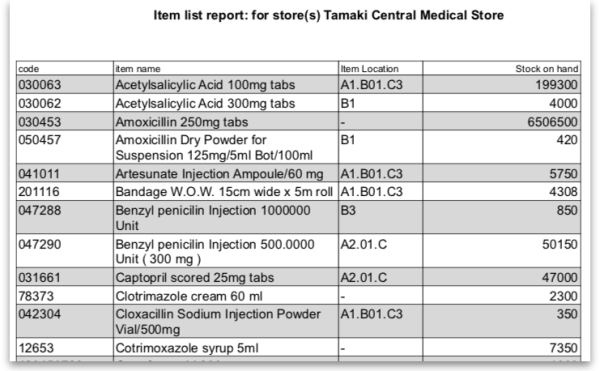
- Code, Name and Shelf Location: Shows exactly what is says with current stock on hand:
- Code, Name, Shelf Location with Item Long Description: Shows the same as the previous one but includes the Item long description.
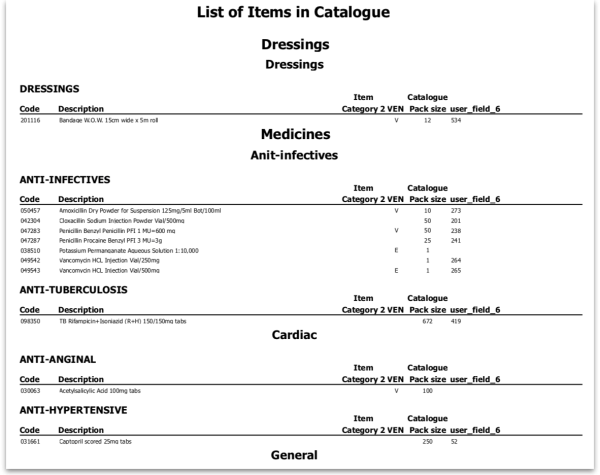
- List of items in Catalogue: Shows item details including the catalogue pack size and item custom field 6 value all separated out by the hierarchical item category 1. Looks like this:


Local / remote report
This option will only show “local data” as an option unless you purchase a web services enabled version of mSupply, in which case you can view reports from remote locations running mSupply. Contact us for more information.
Items out of stock
Selecting this report displays this window:

Specify your required options from the drop down lists;
Days out of stock
Selecting this report displays this window:

Specify your required options from the drop down lists; the desired period may be identified either by entering dates in the From and To fields, or by using the drop down list to the right.
Clicking ok will generate a report like the one below:

Clicking the Complex find button opens the Query Editor, allowing you to enter specific criteria relating to your search.
You may also specify what level in percentage terms of the maximum stock should be considered as being “out of stock..” Here's an example over 1 month:
| Day of month | 1 | 2 | 3 | 4 | 5 | 6 | 7 | 8 | 9 | 10 | 11 | 12 | 13 | 14 | 15 | 16 | 17 | 18 | 19 | 20 | 21 | 22 | 23 | 24 | 25 | 26 | 27 | 28 | 29 | 30 |
|---|---|---|---|---|---|---|---|---|---|---|---|---|---|---|---|---|---|---|---|---|---|---|---|---|---|---|---|---|---|---|
| stock on hand | 20000 | 20000 | 20000 | 2000 | 1000 | 500 | 300 | 200 | 30000 | 25200 | 20200 | 18000 | 18000 | 18000 | 10000 | 5000 | 5000 | 2000 | 2000 | 800 | 800 | 20000 | 20000 | 20000 | 20000 | 20000 | 20000 | 20000 | 20000 | 20000 |
| Out of stock |  | | | This day had maximum stock. 5% of 30000=1500 | | | ||||||||||||||||||||||||
| Note the 5% stock out level = 1500 | ||||||||||||||||||||||||||||||
Item usage
The Item usage report gives you a breakdown of item usage for the last few months, with summaries for the last 2 years, It also includes stock on hand and stock on backorder for each item in the report.
The report produced is very useful for forecasting or for seeing a list of items that need to be ordered.
When you choose the menu item you are shown a window like this:

You can choose the type of report you want to run from the drop-down menu. Select the Item usage [Excel] report to create an Excel report.

This menu also includes an item usage report, a suggested ordering amount report, or to auto generate a tender from the drop-down list at the top. This form is used for all 7 functions. (Note that the Item usage report with pending purchase order option will show you item usage with details of items currently on order and their expected date of delivery).
If you want to report on all items, leave the item name field blank:

otherwise enter an item name or code. For example, to report on amoxycillin stocks, you could enter “amox” into the field.
Depending on the entry in the first field, further options are available in the following two fields, but these will vary according to the entry in the first field. Among the options, he first field allows you to make your selection from the names given to custom item fields in the Preferences if this feature has been used.

If you wish to use shelf locations, then select the shelf location option and specify the desired shelf.
You can use the drop-down list to find Items with a particular code, or to use the values you have entered into one of the custom user fields. If this isn't powerful enough, use the complex find button to display the full query editor.
Click the refresh button  to calculate the number of items these basic parameters will find. This screenshot shows that 17 items meet the parameter specified, i.e. items whose names begin with 'pro';

Only include items whose stock cover is less than...
If you want only to report on items whose stock is low, enter the threshold for days of stock on hand into the second field. For example, entering 90 into this field will only include items in the report whose stock is not sufficient to cover average usage for the next 90 days.
The default of 0 (zero) in this field will include all items with any amount of stock remaining.
Include items with no usage in the last 12 months
If this box is checked, items with no usage over the last year will be included. This will include items for which there are no transactions at all. This check box will have no effect if the previous “days cover” field is filled in, as an item with no usage will have “infinite” cover- any stock you do have is going to last you forever!
Include usage for build ingredients
If you manufacture items, you can choose whether the use of ingredient lines in manufacturing is included in the report or not.
Open report in Excel
Checking this box opens the report in Excel (or any installed spreadsheet program).
Note: If you chose the Item usage [Excel] report from the dropdown list, the Excel box will already be checked.
If you want to save the report in Excel (or any installed spreadsheet program), choose File > Save as.
Item usage report preview

Suggested ordering report
This report shows usage data, months cover of stock remaining and a suggested quantity to order for each item. The Purchaser can review this report to make a final decision on how much stock to order.
From the Item usage report dialogue box, select the Suggested ordering report option from the drop-down menu. Alternatively, select the Suggested ordering [Excel] report to create an Excel report:


Note the extra options for including item usage when calculating item ordering quantities. Also note the option to include ordering for build items. See item builds for more on built items.
Open report in Excel
Checking this box opens the report in Excel (or any installed spreadsheet program).
Note: If you chose the Suggested ordering [Excel] report from the dropdown list, the Excel box will already be checked.
If you want to save the report in Excel (or any installed spreadsheet program), choose File > Save as.
Suggested ordering report preview

Item usage with outstanding purchase orders
The window that appears when you choose this report is the same as the previous one; with exactly the same options available; the report produced differs only in that any lines having outstanding Purchase Orders have the relevant details of the Purchase Order displayed.
Item slow movers
The Item slow movers report shows all items that have more than a specified number of months worth of stock. TIt is very useful for managing under-performing inventory and allows you to quickly to obtain a list of items where a reduction in stock might be desirable.
You will be shown a window to enter the report options:

Enter your search criteria in the top section.
Item name field
- If you want a report for all items, leave this field blank. Otherwise enter some text to reduce the report to just a few items (e.g. entering “am” will produce a report of just the items whose name starts with “am” (Amitriptylline, Amoxycillin, etc)
Category and department
- Use the drop down boxes as appropriate to select Category and/or Department if required.
Base analysis on X months of usage data
This is the number of months of usage data (working back in time from the current date) to use to calculate the AMC (Average Monthly Consumption). The months of stock on hand is then calculated as current stock/AMC.
Report on items that have more than X months stock on hand
Only items that have stock that will last this or a greater number of months will be included in the report. Those with less stock will not be included.
You can check the Open report in Excel checkbox to open the report in Excel, or any installed spreadsheet application.
When you click on the OK button you are taken to the printing options window:

There are two versions of this report, the standard one or one showing the individual batches of each item. Choose the one you want using the Form to use drop down list.
The standard report looks like this:

The one with batches looks like this:

Please note that:
- The months of stock is calculated for all batches together, not for individual batches.
- The maximum months of stock shown is 1200 i.e. 100 years! This figure will be shown for all items that have no consumption as well as those for which you genuinely have that much stock.
Expired stock
This is a customised report only available for few of our clients.

This report shows the stock that expired while it was on your shelves between the dates you seec in the options. It includes current stock that expired between the dates selected and also stock on confirmed customer invoices and inventory adjustment-reduces that was expired when it was put on those transactions (so if you removed stock from the store after it had expired, that is also included as stock that expired on the shelf).
Donor and custom stock fields are included as filter options if they are turned on in the current store.
The report looks like this when exported to Excel:

Expiring items

This report will ask you to enter a date, and will then give a report of all item lines in stock whose expiry date is before the date you have entered.
For example, entering 31/8/11 will display all items with expiry dates before 31st August 2011 (Enter the date in short format in the way your computer is set to handle dates (DD/MM/YY or MM/DD/YY or YY/MM/DD).
You can additionally filter the stock by the location type or the actual location in the warehouse. This is helpful for reporting on items in certain sections of your warehouse.
Three report type options are offered; select as appropriate. You may refine the search by using the Name filter and/or the Item filter..
Donor reporting
mSupply provides the feature of printing the Donor name on the Expiring Items report so that the organisation donating the goods can be identified and tracked. This can help with disposing of or returning goods to the Donor.

Expiring items vs. cover
The Expiring items vs. cover report shows the number of months of cover for items you have in your store. The cover calculation uses the last 12 months of usage data to calculate the AMC which is used to determine months of cover.

Many filters may be applied in the drop down lists, which are the same as described under Item usage… above.
Note that If the field you are searching is a boolean field, e.g.Essential Drug List, “false” appears as the default entry, which you may change to “true”.
Cover calculation
This allows the user to include or exclude specific categories to be used in calculating coverage. Clicking the magnifying glass to the right lists categories to be chosen.
If you wish mSupply to remember the criteria which you have entered, click on the paperclip icon, and your selections will appear the next time you open the report.
Once you have selected your required criteria, click on the Refresh icon to show the number of items which match your criteria, and which will, therefore, feature in the report.
Item ledger

Ledger entries may be viewed in this report; different formats of report are available in addition to several filter options from the drop down lists, so the report may be designed to meet your specific requirements.

The Purchases by suppliers report relates stock received to purchase orders made and looks like this:

The Stock movement with stores report looks like this:

| Previous: 13.01. Report basics | | Next: 13.03. Transaction reports |