This is an old revision of the document!
19.06. Mobile Dashboard set up (after v4.0)
August 2020:
- The instructions on this page are for configuring both
- mSupply's legacy web dashboard. This is now superseded by the mSupply Grafana web dashboard
- mSupply Mobile dashboards. The instruction on this page are still the only way to configure them for mSupply versions 4.0 and later
The following instruction are for setting up dashboards for mSupply versions 4.0 and later. For mSupply versions earlier than v4.0, the dashboard setup is accessed and configured via the mSupply Preferences menu, refer to Dashboard set up (prior to mSupply v4.0).
Before you set the dashboard up you must:
- know what ports are already in use on the server
- have an appropriate SSL Certificate set up.
- make sure your webserver is currently running.
Sustainable Solutions can help with these.
Configure the dashboards
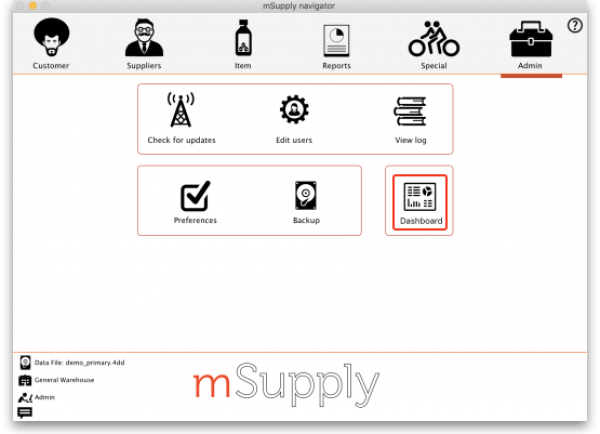
- On the Admin tab of the Navigator click on the Dashboard button:
- This will show you a list of the available dashboard reports:
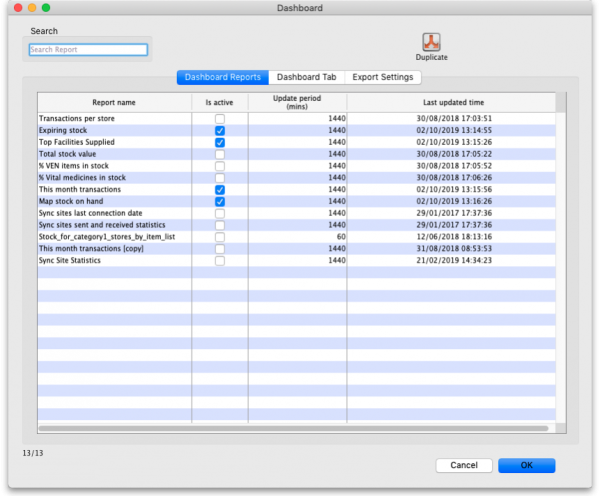
- Tick the box in the Is active column for each report that you want generated. Note that if one or more reports are selected, the scheduled process for generating and refreshing the dashboard reports is automatically started, there is no separate setting for turning it on and off. Similarly, if no reports are selected the dashboard report generating process will be turned off automatically.
- Set the number of minutes in the Update Period (mins) column to set how often each of these reports is generated.
1440is one full day.


The Dashboard Tab tab is for setting up Dashboard tabs (see the Dashboard tabs section below) and the Export settings tab is for telling mSupply when and how to update the data behind the dashboard (see the Export settings tab section below).
Available dashboard reports
There are several built-in dashboard reports that everyone can use. The table below documents what they show and what properties can be edited:
If you would like help with adding one of these reports to your list, contact Sustainable Solutions on support@msupply.org.nz
| Report | Method | Format | Parameters | |
|---|---|---|---|---|
Expiring items for Store Shows a list of items, for a given store, which will expire within a specified number of months. v4.01 | dashboardReportExpiringItemList | Table, Bar chart | monthsToInclude | The number of months before expiry that the report includes (defaults to 3 if this parameter is missing) |
| storeCode | search for a single store matching this code | |||
| dataElement | Looks for the dataElement in the aggregator table. If blank, will default to AMC |
|||
| customisation | allows for a client customisation: currently supports MAM. |
|||
| ven_category | V, E, N or E,N or V,E ..etc will filter for the respective VEN values. If blank, no filtering by VEN value |
|||
| chartType | bar, table. If blank, will default to table |
|||
| Report | Method | Format | Parameters | |
|---|---|---|---|---|
| Expiring Stock Shows a graph of total value of stock expiring grouped by the number of months in which the stock will expire. | dashboard_rep_expiring_stock | Bar chart | None | |
| Report | Method | Format | Parameters | |
|---|---|---|---|---|
| Items issued this month Shows a list of items, per store, which were issued in the last 30 days. Uses store tag and master list to select items to be displayed. | dashboard_itemRow_storeCol_usag | Table | store_tag | Identifies stores to display. Multiple stores can be selected by separating them by comma or space e.g. “bacau,CHC” or “bacau CHC” |
| master_list | Show items which are included in this master list | |||
| period | Number of days from the current date to look back | |||
| Report | Method | Format | Parameters | |
|---|---|---|---|---|
| Map stock on hand Shows a map of the area specified, with an “X” if the facility is out of stock of the item, or a dot representing the amount of stock on hand. | dashboard_map_stock_on_hand | Map | country | Name of country - compulsory but not shown |
| item_code | the code of the item to display | |||
| lat_nw_corner | the latitude of the North-West corner of the map | |||
| long_nw_corner | the longitude of the North-West corner of the map | |||
| lat_se_corner | the latitude of the South-East corner of the map | |||
| long_se_corner | the longitude of the South-East corner of the map | |||
| store_tags | A comma separated list of tags - or omit this parameter if you want to show stock for all stores | |||
| Report | Method | Format | Parameters | |
|---|---|---|---|---|
| Monthly transactions Shows a bar chart of the number of purchase orders, goods receipts, supplier and customer invoices created this month. | dashboard_rep_month_transacs | Bar or Line chart | None | |
| Report | Method | Format | Parameters | |
|---|---|---|---|---|
| Stock_for_category1_stores_by_item_list Shows a table of items in rows and stores in columns, with the stock on hand for that item in that store in each cell. | dashboard_rep_stk_StoreCols_Itm | Table | store_code | code or codes of stores to show. to specify multiple stores enter multiple store_code params (append @ for a “starts with” search) |
| master_list | VHP - All Items Will search for items that are part of the master list : “VHP - All Items” |
|||
| item_code | items whose code matches this code (append @ for a “starts with” search) |
|||
| Category1_description | private Will search for names whose name category 1 is “private” |
|||
| Report | Method | Format | Parameters | |
|---|---|---|---|---|
| Store Transaction Count Shows a count of each store's transactions for the past 7 and 30 days | dashboard_rep_count_store_trans | Line or Bar chart | store_tags | matches stores with this tag |
| Report | Method | Format | Parameters | |
|---|---|---|---|---|
| Sync sites last connection date | dashboard_report_last_sync_date | Table | None | |
| Report | Method | Format | Parameters | |
|---|---|---|---|---|
| Sync sites sent and received statistics | dashboard_report_sync_stat | Table | None | |
| Report | Method | Format | Parameters | |
|---|---|---|---|---|
Sync sites statistics Shows a range of statistics related to synchronisation v4.02+ | dashboardSyncSiteStatistics | table | storeTag | (default = %) - report will select stores where tags match %{storeTag} and sync_id_remote_site > 1 |
| syncDayThreshold | (default = 5) - color cell red when days since last sync > syncDayTreshold | |||
| unfinalisedSIThreshold | (default = 0) - color cell red when number of unfinalised supplier invoices > unfinalisedSIThreshold | |||
| stocktakeDayThreshold | (default = 30) - color cell red when days since last stocktake > stocktakeDayThreshold | |||
| requisitionDayThreshold | (default = 30) - color cell red when days since last requisition > requisitionDayThreshold | |||
| lookBackPeriod | (default = 50) - Look back number of days for Supplier Invoice, Stocktake and Requisitions | |||
| lookBackPeriodCI | (default = 30) - Look back number of days for Customer Invoice | |||
| daysWithCIThreshold | (default = 0.2) - color cell red where 'days with customer invoice' divided by `number of working days` < daysWithCIThreshold | |||
| Report | Method | Format | Parameters | |
|---|---|---|---|---|
| This month's transactions Shows a bar chart of the number of purchase orders, goods receipts, supplier and customer invoices created this month. | dashboard_rep_month_transacs | Bar chart | store_name | If provided the report shows details for the given store, otherwise the default store is used |
| Report | Method | Format | Parameters | |
|---|---|---|---|---|
| Top facilities supplied The 10 customers in your store to which you have sent the greatest value of stock. Shows the value of stock for each customer. | dashboard_rep_top_facilities | Bar chart | None | |
| Report | Method | Format | Parameters | |
|---|---|---|---|---|
| Total stock value A single figure in your default currency, showing the total value of the stock you have in the store you are viewing the dashboard for. | dashboard_rep_total_stock_value | h2 | None | |
| Report | Method | Format | Parameters | |
|---|---|---|---|---|
| Transactions per store Shows a table of the transactions per stores within 30 days | dashboard_rep_month_transacs | Table | store_code | Specify a store by entering a store code, or leave blank for the default store |
| Report | Method | Format | Parameters | |
|---|---|---|---|---|
| Trends in critical stock | dashboard_rep_in_stock_trends | Time series chart | store_id | the ID of the store you're interested in, or no value for all stores |
| critical_stock | TRUE if you want to include items with this field checked, false for all items |
|||
| Report | Method | Format | Parameters | |
|---|---|---|---|---|
| Unfinalised Stock transfers Shows unfinalised stock transfers within the specified time period for each facility which matches the “store_tags” parameter. If no store tags are passed in, transactions are shown for all stores. | dashboardReportUnfinalisedStock | Table | store_tags | Queries only stores with matching store tags |
| days_older_than | Queries transactions that were created 'x' number of days ago | |||
| Report | Method | Format | Parameters | |
|---|---|---|---|---|
| VEN items in stock Shows stock on hand of each items that belongs to the VEN (Vital, Essential, Necessary) category | dashboard_rep_item_ven | Line or bar chart | store_code | store code - if empty then default store is chosen |
| ven_category | V,E,N or E,N or V,N ..etc will filter the VEN items. If blank all visible items for the store are chosen |
|||
| Report | Method | Format | Parameters | |
|---|---|---|---|---|
| Vital items in stock Shows a bar graph of the percentage of medicines of the chosen category in stock at each facility | dashboard_store_stock_percent | Bar chart | ven_category | v or e or n if you want to include items that are Vital or Essential or Necessary |
| user_field_4 | TRUE if you want to include items with this field checked |
|||
| user_field_7 | TRUE if you want to include items with this field checked Note that the labels for fields 4 and 7 may be different, as they are set up in the mSupply preferences (misc tab) |
|||
| critical_stock | TRUE if you want to include items with this field checked, false for all items |
|||
| store_tags | entering healthcentre will only include stores with the “healthcentre” tag |
|||
| Report | Method | Format | Parameters | |
|---|---|---|---|---|
| Item Stock on Hand and Months Cover Shows a table of item VEN status, Stock on Hand, Monthly Consumption, and Months Cover | dashboard_rep_stock_on_hand | Table | store_code | search for a single store matching this code |
| lookBack_months | how many months of data to review when calculating; defaults to 6 | |||
| ven_category | V,E,N or E,N or V,N ..etc will filter the VEN items. If blank all visible items for the store are chosen. If not supplied the filter is not used; specify 'blank' to show items with empty ven. Note: each category in combination must be separated by comma, example: either v,e,n or v,e or v,n |
|||
| item_code | Searches for items matching this code | |||
| customisation | Allows for a client customisation: currently supports MAM. |
|||
If you can't make a dashboard report that does what you want then please speak to us, it's usually a fairly simple matter for us to create one for you.
Editing dashboard reports
Double-click a report in the list shown above and the following window will open:

- If there are any properties shown in the list, these can be edited to change what is displayed.
- To edit a property or value, click once to select the row, and then click again in the appropriate cell to edit it.
- To add or delete a row use the New line and Delete line(s) buttons at the top of the window.
- In the example shown in the screenshot above (a map report), the coordinates of two of the map corners and the item code of the item whose stocks will be shown on the map have been entered. Note that if you add extra properties to the default reports they'll be ignored.
August 2020: The remaining instructions on this page are for configuring mSupply's legacy web dashboard. This may still work, but is no longer supported as it has been superseded by the mSupply Grafana web dashboard. The instructions are left here for historic reference only.
Dashboard tabs
You set up Dashboard tabs which will display on your dashboard. Dashboard tabs are “containers” for one or more dashboard reports. To edit them click on the Dashboard Tabs tab of the File > Preferences > Dashboard window shown above:

To add a tab click the Add button. To edit a tab, double-click it. You will be shown a window for editing a dashboard tab:

Now you add reports that will show on this tab.
Understanding rows and columns
Take this example dashboard tab:

- The tabs themselves occupy their own space on the left of the window- they aren't considered when laying out the dashboard
- The first row has two reports- each report takes up half the row. So for the first report:
- Row 1, Col 1, width 12 (“12” means it takes up the full width of the cell it is in- “4” would mean it would take up 1/3 of the width)
- For the report at the top right:
- Row 1, Col 2, width 12
- For the map
- Row 2, Col 1, width 12
- The next two reports are on the same row, but are divided into 5/12 and 7/12 of the width of the window, so we put them in the same cell but change the width settings:
- Row 3, Col 1, width 5
- Row 3, Col 1, width 7
Adding a report to a dashboard tab
Click New Line to add a new report to the tab. Then edit the values in each column
- Row: The row it will be in
- Column: The column within the row- set to “1” if you don't have multiple reports on this row.
- Report tite: The title that will show in the Orange heading bar for the report. Note that the same report can display different information depending on the parameters you set for that report- hence the need for the ability to customise report names
- Type: You'll need to know the appropriate type for the report you're displaying. The options are
- bar_chart
- table
- pie_chart
- time_series
- map
- line_chart
- Width: The fraction of the cell width in “twelfths” that this report will take up (“6” will make it take up half the cell width)
- Report: Choose the report name from the drop-down list of available reports
Configure users to have access to dashboards
Once the tabs have been setup you have to choose which users will see which tabs. You do this in individual users' settings. For instructions on how to do this, see:
- Managing users > General tab > Users can: (Use the Dashboard permission)
Exporting mSupply data to the dashboard
| Previous: 19.05. Web Dashboard | | Next: 19.07. Online catalogue |