19.05. Web Dashboard
August 2020: The instructions on this page are for configuring mSupply's legacy web dashboard. This may still work, but is no longer supported as it has been superceded by the mSupply Grafana web dashboard. The instructions are left here for historic reference only.
Legacy Web Dashboard
Once the dashboards have been set up (refer Dashboard set up (before v4.0) or Dashboard set up (after v4.0)), it can be used to monitor and access reports from anywhere using an internet browser (such as Chrome, Safari or Firefox).
The address for the dashboard is the public IP address of the server (or its web address if one has been assigned) on the port setup in the web server preferences (see the server preferences section for details) with /dashboard added. For example, if port 3000 is specified in the server preferences and the server is at web address example.com, users would browse to https://example.com:3000/dashboard using their internet browser.
This means users can access dashboard reports using their computer at home or even their tablet or cell phone!
Using the dashboard
Login
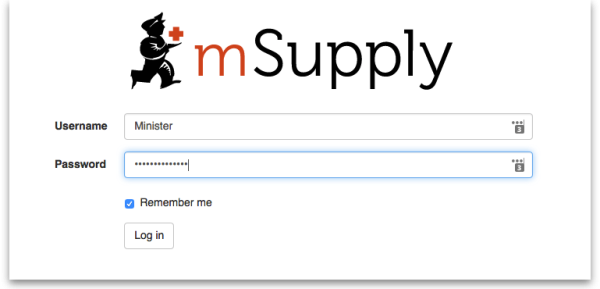
You'll need to be given the right URL (“web site”) to go to in your browser. Type it into the address bar of the browser you want to use (on the device of your choice) and click on the Go button or tap the Enter key. You will be shown the login page:
Enter your normal mSupply login username and password and click on the Log in button.
You will be taken to your dashboard which will show the first “page” or tab set up for you by default. You can click on other tabs at the left of the screen (if they have been set up for you) to see other reports:
The dashboard works just as well on a tablet or your phone, but the different “pages” will be at the top of your screen, not on the left.
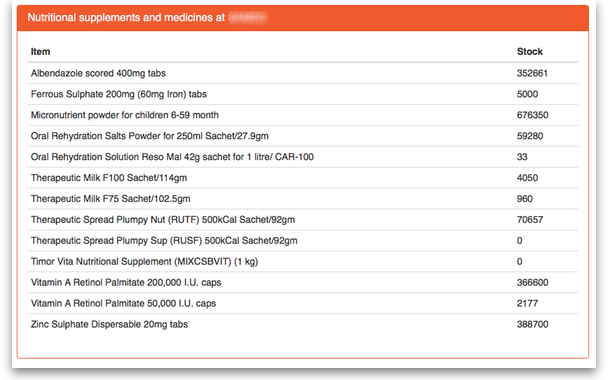
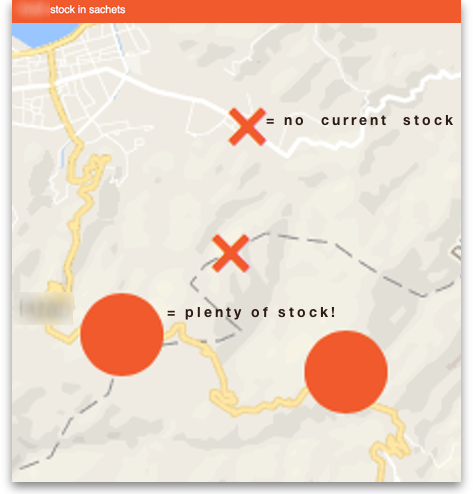
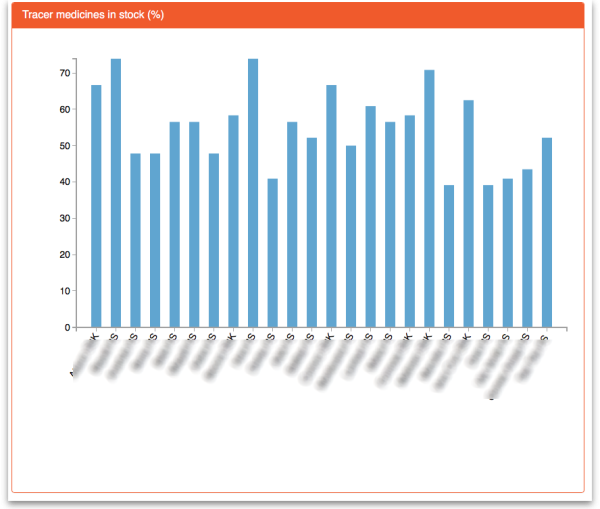
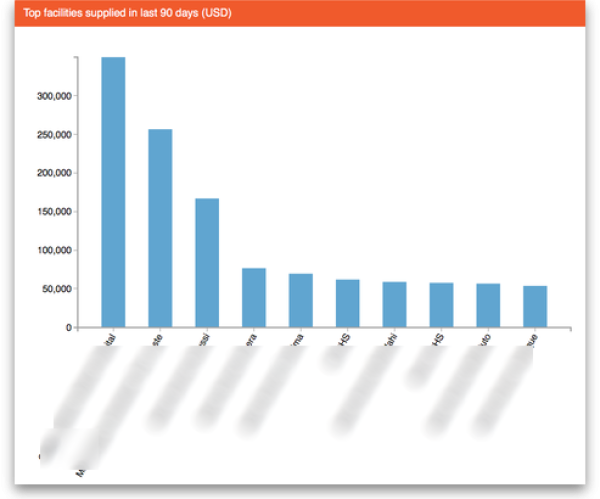
There are several very useful reports on the dashboard, helping you to keep up to date with current stock levels and much, much more. And, if one of the standard reports doesn't give you what you want then it's fairly simple to create a new one from scratch or by duplicating and editing an existing one (see Setting up dashboards). Below are just a few examples of the kinds of reports the dashboard can show for you:
