25.19. The system log
The log contains records of who did what and when in the system. It's a useful place to look to find out what happened to certain records and when certain things were done. Some events (lots!) are always logged by mSupply but some are optional and are chosen in the Log tab of the General preferences page.
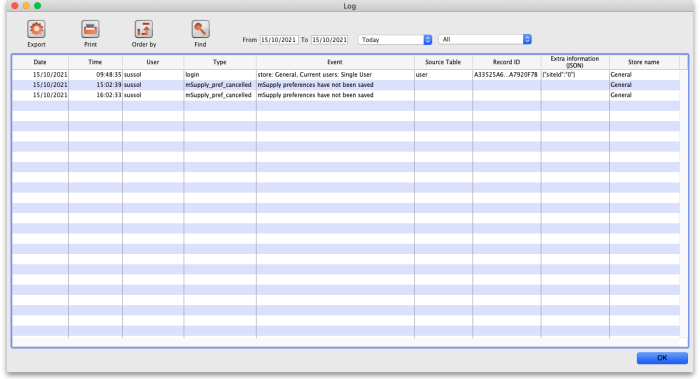
To view the log, choose View log… from the Special menu. You will be shown all today's log entries when the window loads:
The columns contain this information:
- Date: the date when the log entry was made.
- Time: the time the log entry was made.
- User: the name of the user who did the operation giving rise to the log entry.
- Type: the type of log entry. Can be used for filtering or just telling you which part of the system generated the log entry.
- Event: a description of the event that occurred.
- Source table: the name of the table that contains the affected record (if there is one).
- Record ID: if there was one, the ID of the record in the database that was affected by the event.
- Extra information: detailed information about what happened in the event in JSON format. Not always provided.
- Store name: the name of the store that the event occurred in.
Buttons in the window:
- Export Export the log to a tab delimited text file. You can then import this into other applications (such as a spreadsheet application) for editing and printing.
- Print Prints the displayed list of log entries on your printer.
- Order by Sort the log by something than the default date/time order.
- Find Search for particular records in the log.
- OK Close the window.
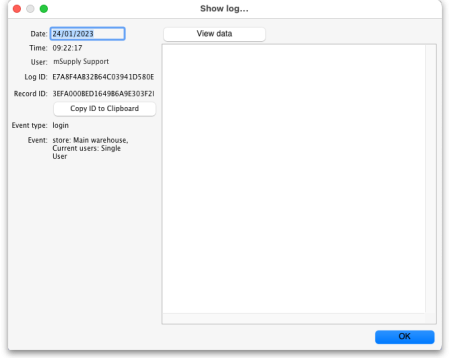
Double-clicking a log entry in the list will bring up a read-only window showing the full log details:
- Date: The date the log entry was created
- Time: The time the log entry was created
- User: The name of the user whoi did the action that resulted in the log entry
- Log ID: The ID of thelog entry in the database
- Record ID: The ID of the record the log entry relates to e.g. the transaction that was edited
- Copy ID to Clipboard button: On click, copies the Record ID value to the Clipboard so you can poaste it somewhere else
- Event type: The type of the event that occurred. Used for filtering
- Event: Description of the event that occurred
- View Data button: On click, if the log entry has additional JSON information, it is displayed in the large panel below the button.
Dates
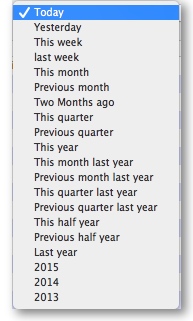
If you want to see log records that were generated over a different period then manually edit the dates in the From and To boxes as required or choose one of the many quick-select options in the drop down list to automatically set them (Today is selected by default):
Event types
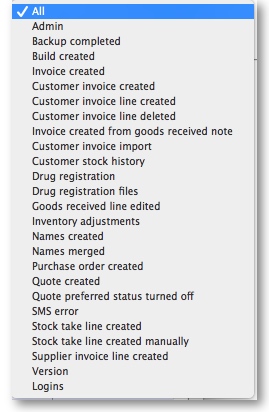
Additionally, you can choose to show only certain types of event which occurred in the period you have selected. To do that, select one of the entries in the final drop down list on the right hand side (All is selected by default):
Custom query
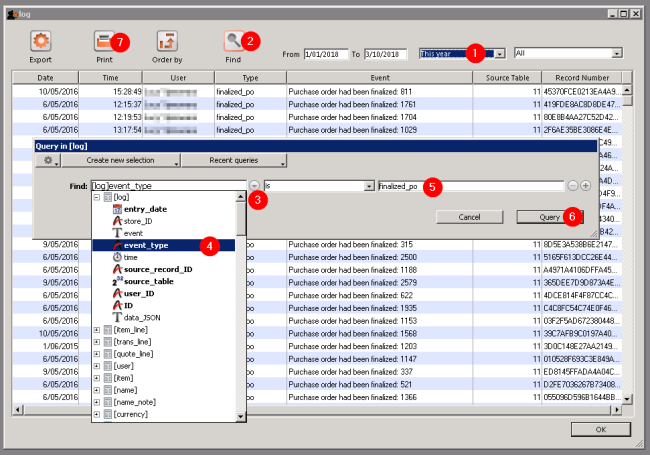
If you are looking for log records that are not in the list of common event types described above, you will need to create a custom query. For example, to find a report of all the finalized POs this year:
- Set the date / time period
- Click on Find
- Click on the small right arrow to the right of the first field box
- Select the data type that you are looking for. In this case, we are looking for the
event_type - Type in the particular event type that we are looking for. In this case, we are looking for the
finalized_po - Click on Query
- Once you are happy with the included results, click on Print (or Export to produce a text file that can be imported to Excel and manipulated)
| Previous: 25.18. Label printer hardware setup | | Next: 25.20. Server troubleshooting |
