13.14. Custom reports
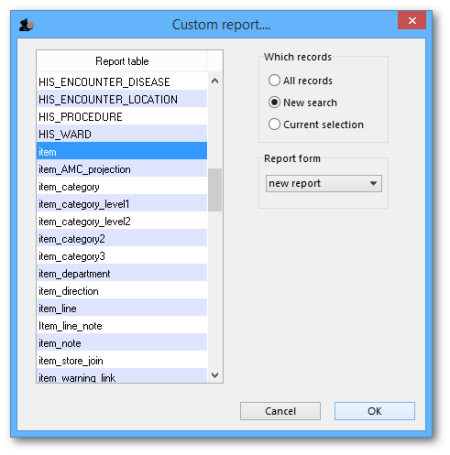
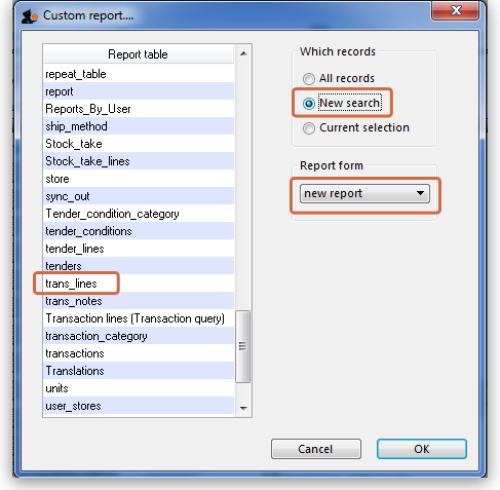
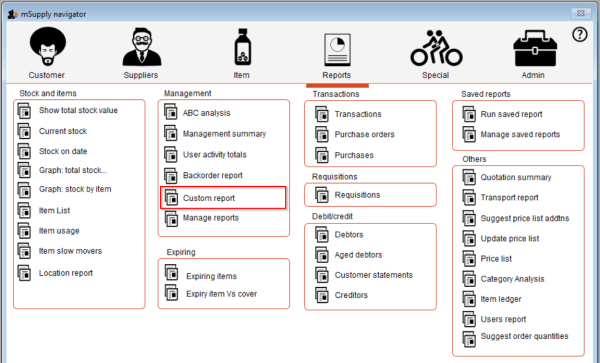 Choosing this item brings up a window for creating a custom report:

The custom report window is displayed allowing you to create a report according to your own requirements using the Quick Report editor; once created you may save the form of the report in the custom reports folder for future use.
The window requires you to make three choices:
Report table
A list of tables on the left to choose which table (which type of records) you want to report on, e.g. Names, Items, etc.
As of version 1.6 there are two options for transaction lines. The “Transaction lines (Transaction query)” option allows you to search much faster on a large number of transaction lines. For example, if you are wanting to get the quantity of each item given to customers in a specific month, you would use this option.
Which records
A series of radio buttons to choose which records to examine
- All records
- New search (query), if you want to report on records meeting specific criteria. If chosen, you will be presented with the Query (search) editor, where you can build search statements to your heart's content! A short description of using the query editor is given below, and two example searches are later described. For a more comprehensive description, a range of books is available either in electronic or hard copy versions. Please email info@msupply.org.nz for more information.
- The “Current selection” is the group of records that were last displayed. For example, you can use the Item | View or edit item command quickly to find all items starting with “a”. When you click the OK button, the items in the list are the “current selection”. If you are not sure which records represent the current selection, you should click the “new search” radio button.
Report form
A drop down list displaying available options:
- New report
- After clicking the OK button you will be presented with the report editor where you can design a report. The report editor is somewhat complex, but time spent in learning how to use it is time well spent. It is a powerful and invaluable feature. A brief introduction together with designing two simple reports are given in Designing a Report below, and more details are available in training courses on using mSupply, and in publications available from Sustainable Solutions.
- If you want to save a report or search (query), you can save them on your hard disk, and retrieve them next time you run the report.
- If you save the report you have created in the Custom reports folder it will show up in the report form drop-down menu on future occasions when you choose custom report.
- The default location for saving your custom reports is My Documents\mSupply\custom reports; it is important to note here that any custom reports you have created should not be saved in the My Documents\mSupply\Reports folder, otherwise problems may arise.
- New label layout
- Presents you with the label editor, where you can design and save label layouts. These are useful for use with names for addressing envelopes, and with Items for making tags for labeling shelves in your warehouse.
- If you choose this option the “Order by” window will appear after a query. This allows you to sort the records into a particular order before printing labels. (In a nutshell: Drag fields from the list on the left to the list on the right to use them for sorting)
- Other items in the menu
- If you have saved any reports in the custom reports folder they will be listed here.
A list of the fields in each table, and what each field contains is given in section 24. Data Tables and Fields.
Using previously saved layout
Any report layouts which you have used previously, and saved, may be accessed by clicking on File >Open on the menu bar, and selecting the required layout.
Using the Query search editor
There are now many reports included in mSupply®, but there may still be occasions when you require a report that we have not included. The query editor is a bit daunting, but is very powerful and once you are familiar with its capabilities, your competence to access the precise information you may require from within the mSupply database will increase significantly.
When you open the Custom Report editor, it is ready to take input values for a simple single line query.
- The field to query. Choose this by clicking on the Find drop-down list which allows you to also choose fields from related tables. If you want to perform related queries, see note below.
- The Comparator. Choose the comparator from the list of fields by using the middle drop-down list.
- The Query value. Is entered in the third box. In the example above, the field chosen is an alphanumeric field (the item ID), so an entry area is displayed where you can enter text or a numeric value - in this instance the item code “amox” has been entered. Note that you can also use the “@” symbol as a wildcard in your query value to perform “contains” queries.
- The Conjunction. This does not apply to the first line of a query, but the second and any further lines need to start with a conjunction. Set the conjunction for the selected line by clicking the appropriate button in the left area of window ( And, Or or Except )
To add lines to a query, click the Add Line button.
Related queries: If you want to perform related queries, you need to know a little about the internal structure of mSupply data. Please contact us if you would like a diagram of the table layouts. A simple example of a related table is that each transaction line is related to a transaction (many to one relationship). The means that you can use the information stored in the transactions table (eg invoice date, number, status, etc.) to query transaction lines.
If you have created a complex query that you might wish to use on future occasions, you can save it to your hard disk and select it again using the Save and Load buttons in the window.
Once your completed query is entered, click the Query button to proceed.
For more detailed information on the Query search editor see: http://doc.4d.com/4Dv16R6/4D/16-R6/Query-editor.300-3561635.en.html
Designing a report
The designing of two custom report is now described:
- listing in alphabetical order the small number of items which may be supplied to staff or customers who wish to make a purchase without a prescription. These items have already been identified by making use of their User field 2, which contains the entry “Retail permitted”.
- listing the sources (suppliers) and the distribution (customers) of a particular batch number of an item - useful if a manufacturer recalls a particular batch of an item.
It is recommended that you study both examples, as features described in the first example will not be repeated in the second.
Report 1
Having selected Custom Report from the Reports page in the Navigator, you are presented with this window:
For our example report, we select the Items table, and to perform a New Search, using a new report form, so with these options selected, the window now looks like this:
Click OK, and the Query Editor window appears, as shown in the upper figure below; this is where you specify the criteria on which you wish to create your report - in our simple example, the single criterion is that there should be stock on hand of the item. In the lower window, we have specified this by:
- clicking on user_field_2 in the Available Fields panel on the left,
- clicking on contains in the Comparisons panel on the right, and
- entering “Retail” in the Value panel below.
You will see that the conditions we specified now appear in the upper panel - it's always a good idea to check here to confirm that the report will conform to your specified criteria.
Now click on the Query button in the lower right corner.
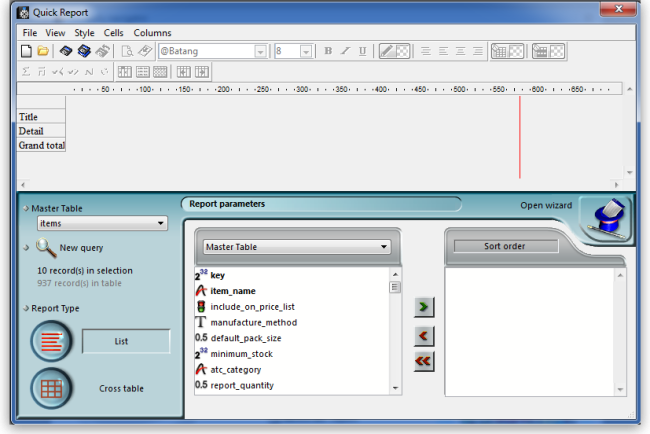
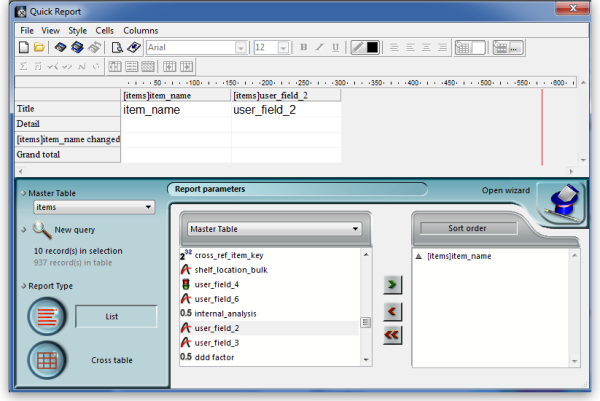
The Quick Report window appears; this is where you can design the layout of the report, and specify how you want the records to be sorted:
We'll start by taking a closer look at the Quick Report features.
There are two operation modes available which generate two specific types of reports: List and Cross table . Our examples are limited to the List mode. The Cross table mode will not be described.
In the List mode, reports typically display records as a list with break rows where calculations are performed.
When you create a quick report, you can specify the following:
- Columns that display fields or formulas, either from the current table or from related tables.
- Sort levels and order.
- Summary calculations.
- Display format.
- Text for labels.
- Formats for numeric and Boolean data.
- Font, font size, style, and justification for labels, summary calculations, and data.
- Background colours on a cell column or row basis.
- Borders, Page headers and footers.
- Presentation style from a wide range of templates.
- Master Table: This is the master table that will be used as a basis for generating the report. The fields of this table are displayed in the Fields list and the related fields will be displayed in relation to this table.
- Fields list: This list lets you select the fields to be inserted into the report by double-clicking or by drag and drop. You choose the type of display in the Field selection list located just above the area. Indexed fields appear in bold. You can also display and select the fields of related tables.
- Column dividers: These lines show the boundaries between columns of the report. They can be moved manually to enlarge or reduce the size of each column. Manual resizing deselects the Automatic Width option if it has been activated for the column concerned.
- Cells: A cell is the intersection of a row and a column.
- Scroll bars: You use the scroll bars to view parts of the quick report design that extend beyond the area of the quick report form.
- Sort list/Sort order display area: This list displays the fields of the report on which the sort will be carried out, as well as the sort order and whether it will be ascending or descending. Each field inserted into this list causes a sub-total row to be added in the Quick Report area.
- Quick Report area: This area lets you build your report by inserting fields using drag and drop, double-clicking or via the contextual menu; you can also adjust the width of the columns added, or delete breaks or formulas, define the colors and borders of cells, etc.
- Title row: This row displays the names of fields or formulas that have been inserted into the report. It is repeated for each page of the report. The Quick Report editor inserts field names by default, but you can modify the contents.
- Detail row: This row contains information drawn from each record and is repeated in the report for each record. You can associate a display format with it, depending on the type of data represented.
- Subtotal rows: These rows display intermediate calculations as well as the wording that is associated with them. A row is created for each sort order.
- Column data sources: These titles indicate the source of the data for each column.
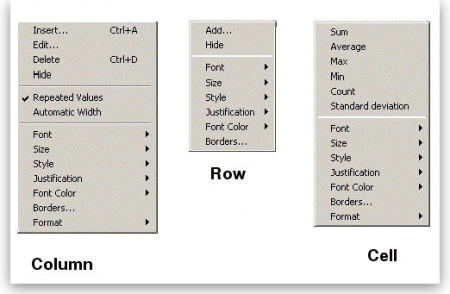
Contextual menus
The Quick Report editor has contextual menus that make it easy to access certain row, column, and cell operations. Instead of making menu selections or working with the Cell or Column properties areas, you can perform certain operations by displaying a Quick Report contextual menu.
There are separate contextual menus for row, column, and cell operations.
To use a contextual menu:
- Position the pointer in a cell, a row title, or a column heading and hold down the right mouse button (on Windows) or press the Control key while clicking in the report area (MacOS).
A contextual menu appears. The commands in the contextual menu depend on where your pointer is (i.e., a row label, column heading, or cell). Also, menu commands that are inappropriate for the particular row, column, or cell are disabled.. - Choose the desired menu command:
Selecting rows, columns, and cells
When designing a Quick Report, you need to select rows, columns, and cells in the quick report form. A cell is the intersection of a row and a column.
- To select a row: - Click on the Title, Detail, Subtotal, or Grand total cells in the row label area.
- To select a column: - Click the Header row of a column.
- To select a cell: - Click the cell.
Adding and modifying text
You can add or modify text in the quick report form to label parts of the report. For example, if you requested summary calculations, you can label them by adding text to other cells in the Subtotal and Grand total rows.
You can add and modify text as follows:
- Edit the text that automatically appears in the Title row of the report,
- Insert text in empty cells of the Subtotal and Totals rows,
- Insert the value of a Subtotal field in the Subtotal rows,
- Specify the font, font size, justification, and style for any text that appears in the report.
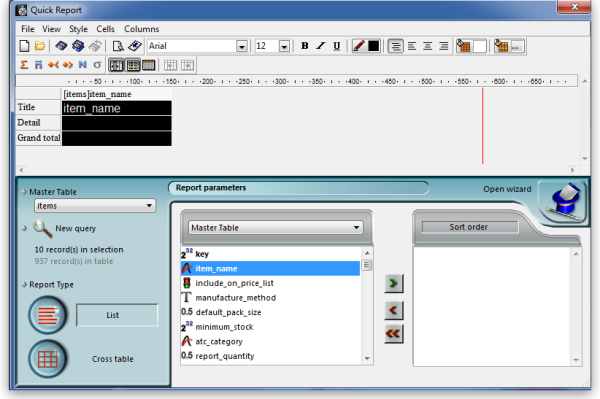
Returning now to our first report, we want two columns only, the first listing the items in alphabetical order, and the second confirming the entry in User field 2. This is achieved by double clicking on item name in the list, and then to have the list sorted alphabetically, make sure item name remains highlighted, and click on the green arrow in the centre:
The second column in our report will show the present stock of each item, and the same procedure is followed; select the user_field_2 entry in the list, and double-click on it. You should be aware that items which are presently out of stock will not appear in the report.
The Quick Report window should now look like this:
The column widths can be adjusted as appropriate by positioning the cursor on the dividing line between the column headings, clicking and dragging to the left or right until the desired column width is obtained:
The vertical red line to the right of the columns indicates the right hand edge of the page as it will be printed, so to keep the report to single page width, columns should be positioned to the left of this line.
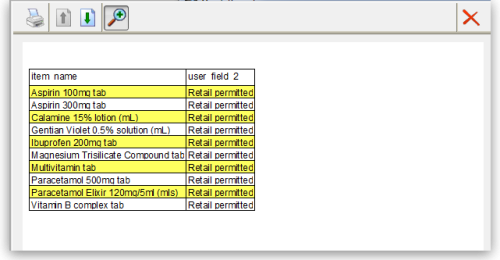
To preview on screen the report as it will be printed, click on File on the menu bar, and select Print Preview. Our example is very brief, but in reality, reports may run to two or more pages, and you can scroll through the pages of the report. This shows how our simple report will appear:
The printed report may benefit from shading or colouring of alternate rows, and this is achieved while the report format is being set. In the Quick Report editor, click on Detail to highlight the row, then click on the Alt.background colour icon, and a chart appears from which you can select the colour(s) of your choice.
For our report, pale yellow has been selected for the alternate row colour, and the report now has this appearance:
Adding report title
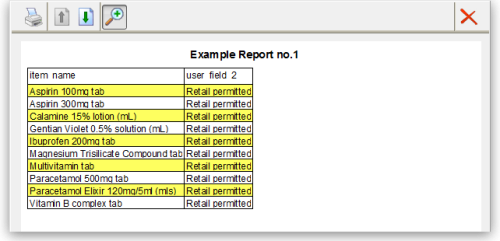
You may want to give your report a title to appear at the head of each page; this is achieved by clicking on File , then Header and Footer ; a window appears in which you can create and/or edit such a header You will most probably want the header to appear in the centre of the line, and in this case, type your entry into the Center panel in the Text Settings area; here you can also select the font of your choice, and features such as bold, underlined, etc.; these apply only to the header, not to the body of the report. A title has been added to our example:
To print the report, click on File on the menu bar, and select Generate and - provided that your printer is connected, online and loaded with paper - your report will be printed.
Report 2
The second report lists the sources (suppliers) and the distribution (customers) of a particular batch number of an item - useful if a manufacturer recalls a particular batch. The item chosen for our example is Metoclopramide 10mg tablets, the code for which is Metclp10, and the batch no.is BN1234
Having displayed the custom report window, this report requires us to select the trans_lines table, and to perform a New Search, using a new report form:
When the Query Editor window appears, expand the [Items] table, and once expanded, move down the list until code appears, and select it by clicking on it;the upper panel now shows [items]code , the default comparator is equal to ,and so to complete the line, move the cursor to the Value entry panel in the lower part of the window and enter 'metclp10'. Click on Add Line and accept the default conjunction And ; In the Available Fields panel, shrink the [Items] table, expand the [item_lines] table and select batch, accept the is equal to comparator, and enter 'BN1234' in the Value entry panel. You have now defined the criteria for the report, and the Query Editor window should look like this:
You are now ready to click on the Query button.
The Quick Report design window appears, with the Master Table - in this example the 'Transaction lines' table - expanded for selection of the fields required by our report; we'll be using four fields from the master table, namely item name, batch, pack and quantity; double-click on each of these in the list, and the Quick Report design window should appear as shown:
Don't be concerned at the order in which these fields appear in the report - we'll rearrange the order once all the fields have been selected. The fields we now need to add are in other tables; presently Master Table is selected ,and we need Related Tables , which is selected from the drop-down menu.
The table to access is the Transactions table, and the fields we require are Invoice number, type, and confirm date. Double-click on each, then expand the Names table, and double-click on [names]name.
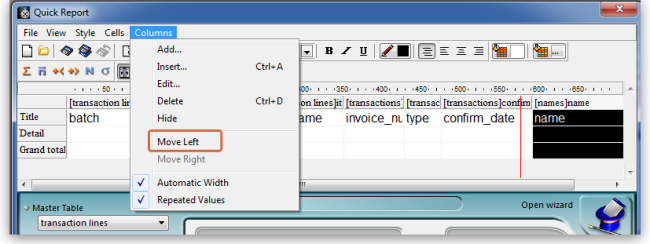
All eight fields for the report are now selected, and we can arrange them in their required order. This is easily performed by selecting the column to be repositioned - we want the item name to be the first column, so we select it by clicking on the column heading, and move it by clicking on the 'Move Left' icon.
Select and move the columns using the 'Move Left' icon and the 'Move Right' icon until the column order from the left is:
- Item_name
- Batch
- Name
- Type
- Invoice_num
- Confirm_date
- Pack_size
- Quantity
The report will look better in landscape rather than portrait form, so click on File > Page Setup , and select landscape Once you have done this, you can view your report on screen by clicking on the 'Print preview' icon.
The next steps are :
- to sort the report
- to perform some simple calculations
- to display this information.
- to adjust the column widths
All these are simple to perform on the Custom Report window:
- Sorting the report. Drag and drop in the 'Sort order' panel the parameters required - in this example [Transactions]type and [Transactions] confirm_date.
- Performing calculations and displaying the information. We need to count the number of transactions, and display the totals involved. Observe the two rows added to the report annotated with the sort parameters followed by 'change'; these are the break points in the report, and the results of any calculations are displayed in these rows ….. here's how:
- position the cursor in the Invoice column on the [Transactions]type changed row
- click Cells on the menu, and check Count; we need to know how many customers have been supplied with this batch, so the Count icon is inserted in the row - it does not matter which column has the Count icon - for the time being it is entered in the 'Invoice' column, and the reason for this will soon become apparent.
- also required is the total quantity ordered, and the total quantity distributed, so the cell in the same row but in the Quantity is selected, and this time the Sum box is checked in the Cells drop down list.
- Column widths can be adjusted as described earlier, and having a look at the Print preview will enable appropriate widths to be defined.
The report should now appear something like this:
Only two tasks remain! It's not necessary to display the Invoice type, so this column may be hidden - right click on the column heading, and from the contextual Column menu, click on 'Hide'.
mSupply® by default enters the field name in the displayed column heading, but you can edit these column headings by double clicking on the cell in the 'Title' row, when an insertion point cursor appears and the current entry is highlighted; you can replace the default text with whatever you consider appropriate. This has been done in our example.
Finally, there is a large selection of presentation styles available, any of which can be applied to your report. On the menu bar, click on Style > Presentation. In our example, after defining a header for the report, we have opted for Report 1, giving our report the appearance you see below.
At some time in the future, you may wish to run your reports again. You should, therefore, save a copy of each report in the Custom Reports folder; this is performed by clicking on File on the menu bar, and selecting Save or Save as, giving the report a name, and saving it in the Custom Reports folder, or any other appropriate location of your choice. Then when you're ready to run the report next time, having specified your criteria in the Query Editor, when the Quick Report window first appears, click on File on the menu bar, select Open, and retrieve the desired report from its saved location, preview it and print it.
Using custom methods in quick report columns
Sometimes you will need to use a custom method in a column to extract data from a related table.
The following methods are available.
| Method | Description | Parameters |
|---|---|---|
| date_day_number_to_text | returns 1 for Sunday, 2 for Monday etc. | |
| qr_account_code_return | Returns the account code of an item | item_id |
| qr_flag_value_change | ||
| qr_get_currency | ||
| qr_get_current_patients_stat | ||
| qr_get_item_store_field | return value of field as text | 1:item.id 2:“price” or “is_in_catalogue” or “sellprice” |
| qr_get_location-from_key | ||
| qr_get_loc_from_key_new_process | ||
| qr_get_Name_code_from_key | ||
| qr_get_stockOnHand_from_itemKey | ||
| qr_get_store_name | ||
| qr_keep_accumulative_value | ||
| qr_ns_customer | ||
| qr_responsible_officer | ||
| qr_ship_method |
| Previous: 13.13. Saving report templates | | Next: 13.15. SuperReport editor |

