4.01.04. Items - Usage tab
Back to Item Details window
BEWARE! Once set, the options on this page will continue to govern every forecast generated by mSupply for this item in this store until you change it! It can be easy to forget that a particular item has been given different settings for calculationg its AMC.
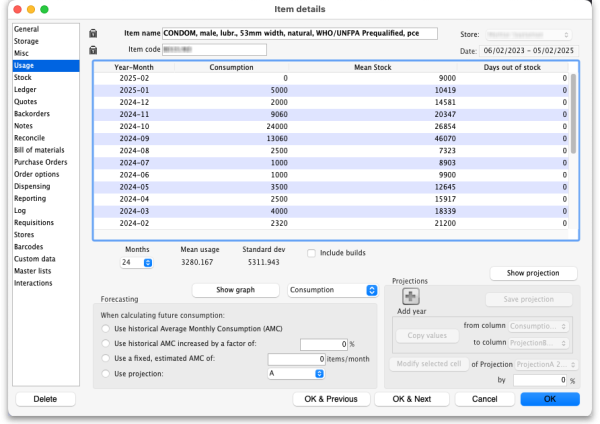
The Usage tab allows you to view the historic item usage per month in the store that you are logged in to. This information is very useful for quickly spotting a trend in usage for a particular item. You can also change how mSupply makes forecasting calculations about this item when creating automatic tenders, calculated purchase orders or suggested ordering reports.
This is what the tab looks like:
The Date field above the table on the right hand side is read only and shows the range of dates covered by the historic usage information in the table. The last date will always be the current date, the first date will be the number of months in the Months drop down list before the current date.
The Months drop down list alllows you to choose how many months usage data to show in the table, from 1 to 60 (5 years!). After choosing a value, the Mean usage (average) and Standard deviation figures will be updated to give the figures for the period chosen (the period is from the selected number of months ago to the current day i.e. the period shown in the Date field above the right hand side of the table).
Refresh usage button: This button allows you to update the usage with transactions that were added since you opened the window (this applies to multi-user mode). It also allows you to show the usage with or without build transactions included in the totals, depending on whether or not the Include builds checkbox is checked.
Include builds checkbox: if checked then mSupply will include confirmed builds (see the 4.07. Building (manufacturing) items page for details) in the usage calculations. If it is not checked (the normal setting) then build will not be included.
If a user has the View items permission but not the Edit items permission, they are still able to use the functionality described here to investigate the usage of items in the store that they are currently logged in to since this makes no changes to the properties of the item itself.
Show Graph button
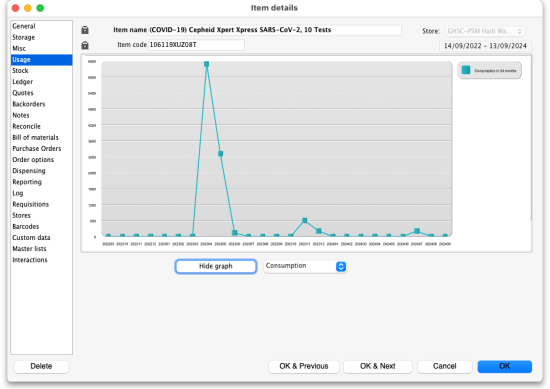
Clicking the Show Graph button will replace the table with a graph showing the information selected in the drop down list to its right. Here is an example of a Consumption graph:
The horizontal (X) axis is the period selected on the Months drop down list, the vertical (Y) axis shows the value of the property slected in the drop down list next to the Show/Hide graph button for each month.
You can show consumption, mean stock, days out of stock, projection A and projection B on this graph.
Forecasting
This section allows you to set how mSupply calculates future usage of this item when automatically generating tenders, calculating purchase orders or creating a suggested order report. For a more general discussion on forecasting in mSupply, see the 4.21. Forecasting page.
- Use historical Average Monthly Consumption (AMC): This is the default option, and is the recommended method. This option tells mSupply to just use the calculated current average monthly consumption for future consumption. Whenever this method is used, there is usually a place to tell mSupply how many months of usage data to use when calculating the current AMC. AMC = sum of consumption over X months divided by X.
- Use historical AMC increased by a factor of X %: When this option is selected mSupply will still calculate requirements based on the historical AMC calculation above, but the value will be increased by the percentage you enter. For example, you may know that the population increases by 2% per year, and so you can enter 2% here to account for the probable increase in demand this represents.
- Use a fixed, estimated AMC of X items/month: This option allows you to specify a particular, fixed amount that will be consumed in all future months. For example, you might have calculated a target consumption for an oral contraceptive based on fixed population and coverage targets.
- Use projection (A or B): This option tells mSupply to use one of the projections you can enter in the projection section (see below). A projection can have different, fixed values for each month and will be useful if you have calculated the future consumption pattern in other software. If you select this option make sure you enter the projection values! If your use of the consumption figures goes beyond the month you have entered the projection values for then 0 consumption will be used for those months.
With this option, mSupply allows you to maintain an A and a B projection, and easily swap between them. Of course you must enter projections for this to be of any use!
You can imagine that setting these options for many items could be time-consuming. Hoever, mSupply has a function for setting them for many items, see the 4.01. About items page for details.
Projections
Projections are used when you want to use a fixed, varying AMC that has typically been calculated outside mSupply. You can enter two projections, which are useful, for example, for capturing minimum and maximum predictions of usage. To view or edit projections, click on the Show projections button on the right hand side. The table changes and the Projections section of the window is enabled:
You can enter projections in a number of ways:
- Manually entering projections: Click once on a cell that contains a projection (these are cells in the columns with a blue rather than grey background) and edit the cell's value. Don't double-click!
Press the Tab key on the keyboard to move from editing once cell to immediately editing another without having to click again.
- Copying a projection: You might want to copy historical data as a starting point for your projection. You can do this by choosing a column in the from column and to column drop down lists in the Projections section, then clicking the Copy values button. This will copy the values in the from column to the to column.
- Modifying an existing projection: You can use the Modify selected cell button to increase or decrease a column or some cells in a column by a certain percentage. For example, you might have entered values for 2025, and then decide your 2026 values should be the 2025 values plus 8%. To do this:
- Fill in your 2025 column values
- Add a column for 2026 if one doesn't already exist (click on the Add year button)
- Use the Copy values button to copy 2025 to 2026
- Click on the top row of the Shift click the bottom row to highlight all rows in the 2026 column
- Enter
8in the percentage field, then click on the Modify selected cell button to increase the 2026 values by 8%.
Good things to remember when you're using projections:
- Use the Add year button to add another year (for both projection A and projection B).
- Click the Save projection button when you want to save any projections (they will all be saved when you click this button). IF YOU DON'T CLICK THIS BUTTON YOUR PROJECTION WILL NOT BE SAVED! There is no auto-save of projections when you leave this window. So, if you want to undo any projection changes leave this window without clicking on the Save projection button.
- If you have added extra years, they will not be shown when you first open the Projections window. Just click on the Add year button to show the years you want to see.
- If you want to go back to the usage view click on the Hide Projection button.
If you are using projections for a particular order, you only need to fill in future values for the period to be covered by your ordering. BUT leaving future projections at zero could have serious consequences when you come to ordering later… 
| Previous: 4.01.03. Items - Misc(ellaneous) tab | | Next: 4.01.05. Items - Stock tab |


