13.11. Other reports
ABC analysis
This report will rank the items based on the value sold in the period specified. Sometimes such a report is referred to as an “ABC” analysis or a “pareto” analysis. Statistics show that 20% of the items supplied by an organisation usually generates 80% of the total value of sales. Therefore, it is useful (and wise!) to concentrate first on the 20% of items that are most important. This report makes it easy to do just that.
You might be interested in what Wikipedia has to say about ABC analysis
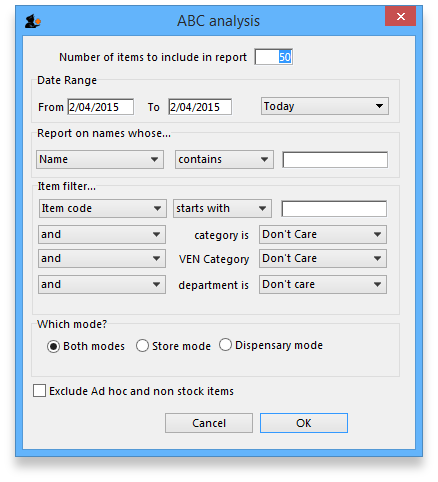
You need to enter the following information:
Number of items to include in report: Enter the number of items to be included in the report.
Date range: Enter the dates you wish here. Each item will have its “analysis” field updated with the total value of sales during the period specified.
Filters: Should you wish to apply filters to the report, three are available - for items, categories and departments.
Which mode: You can choose store mode, dispensary mode or both modes of transactions for inclusion in the report.
Exclude Ad Hoc and non stock items: If you check this box then Ad Hoc and non stock items will not feature in the report.
The report lists the number of items specified, ranked by value of sales, starting with the highest. The value of sales and the percentage of the total value are also shown. Note that the total value is the total for the items in the report, not the total sales for all items. If you want to report on the total for all items, set the Number of items to report on to a number greater than the number of items in your data file (Note that this may make the report very long, but you can choose just to print the first few pages if you wish).
Management summary
This report is designed with line managers in mind, or other people who want to “keep their finger on the pulse” of their organisation but are not interested in the fine detail!
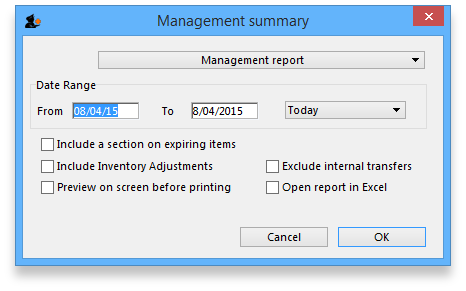
You'll be shown a window where you can choose a date range for the report:
The report provides the following information:
- The total value of stock on hand
- The 10 items with the largest stock value
- The 10 items with the largest value of supply to customers in the date range chosen.
- The 10 suppliers from whom you have purchased the most in the date range chosen.
- The 10 customers to whom you have supplied the most in the date range chosen.
- If you check the “Include section on expiring items” checkbox, a section will be included that lists:
- The cumulative liability for expiring items for each of the next 12 months.
- The 12 most valuable expiring items (or at least batches of particular items)
Preview on screen before printing
Check this box if you want to view your report on screen first.
Open report in Excel
Check this box to view the report directly in your chosen Spreadsheet program.
Quotation summary
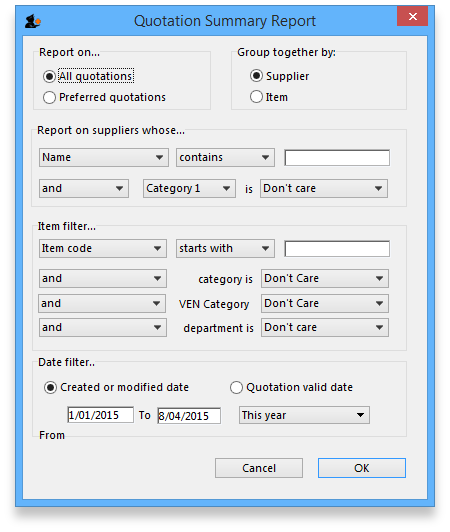
There are two options in Report on section, namely: All quotations and Preferred quotations , and there are two options in Group together by section, namely Supplier and Item
All quotations shows the quotations in which Preferred is set to “true or false”.
Preferred quotations shows only those quotations in which Preferred is set to “true”.
Supplier option displays the quotation report on the basis of supplier.The quotations for the items related to a particular supplier are listed along with that supplier.
Item option displays the quotation report with the items arranged in alphabetical order along with the corresponding supplier's name.
In addition there are filters allowing you to narrow your search further by:
- limiting the report to suppliers meeting your specified criteria - e.g. the supplier's name code may be entered, so the resulting report will display only quotations from that particular supplier.
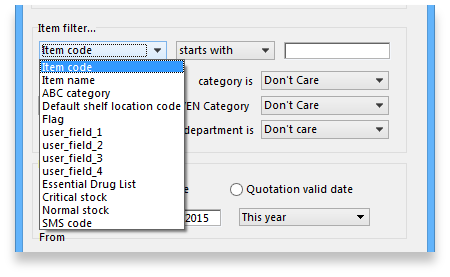
- specifying criteria relating to the item by choosing from the many options in the drop-down boxes as shown below:
There is an additional filter, the Date filter, allowing you to specify the dates on which the Quotations you are examining were created or modified, and the radio button toggles display of the quotations' expiry date ( Quotation valid date ) on or off.
Sync report
This report allows you to track simple remote site activity. There is more in depth remote site activity available on the mSupply dashboard (see the https://docs.msupply.foundation/dashboard/introduction/ page for details). To run it, choose Report > Sync report… from the menus. There are no filters and the report will open automatically in your default spreadsheet application. It looks like this:
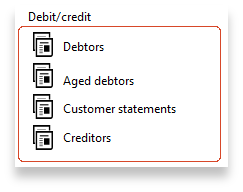
Debtors and creditors
Debtors
This report will produce a list of all debtors. mSupply uses an open-invoice system of accounting for debtors, so the outstanding amount for each debtor is displayed; for debtors with more than one invoice outstanding, the amount displayed is the cumulative total of all outstanding invoices.
Note that the total outstanding on invoices is not reduced for any previous overpayment by a customer, but this is listed in a separate column in the report.
To remove overpayment amounts from the system, choose customer | new payment… and enter the name of the customer with an overpayment. You will be asked if you want to use the overpayment amount for this payment. Choose use, then allocated the overpayment to outstanding invoices.
Creditors
Aged debtors
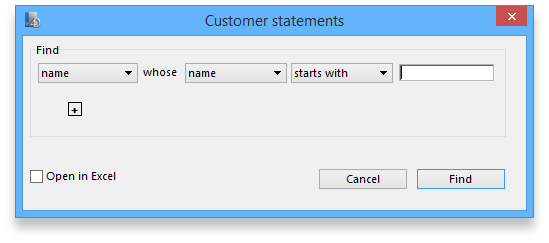
Customer statements
You will be presented with a window to find customers.
If you want a report for all customers, leave the entry field blank. Click OK and a report will be produced for any customers who match the criteria entered. Note that customers with no amount outstanding will not have a statement printed for them.
Transport report
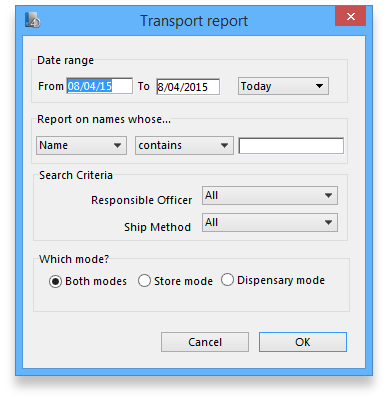
This report allows you to print information about the transport details for a range of invoices.
First you are shown a window where you can select a date range and choose to report on only invoices supplied by a particular method, by a particular responsible officer, or to a particular name or names.
Click “OK” to run the report.
Note that transport details can only be entered on customer invoices if you have checked the “We use box numbers” option in the Preferences
Prescriber report
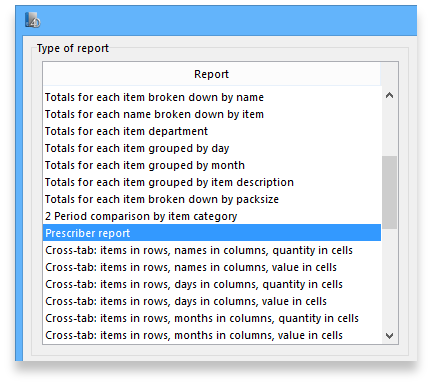
The Prescriber report allows you to view the total value, mean item value and item count for prescriptions dispensed for each prescriber.
You will be shown a window with the normal date range options, and the option to report only on prescibers whose type field is set to a certain type.
Click OK to proceed.
The window that appears is the Transactions report, but you will see that the Prescribers report is highlighted.
As usual, the report options window is shown where you can choose the destination and set headers and footers.
User activity totals
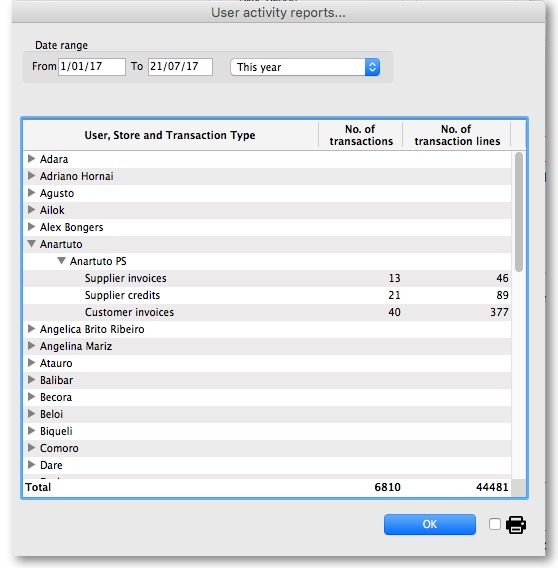
This report was initially made for use in dispensing situations where you want a quick count of the number of prescriptions and items issued in a day. However, it is also useful for getting a quick view of workload for a month or a year in store mode. This report gives the number of supplier invoices (or prescriptions) and the number of stock lines on them, reported by user.
Choosing this menu item shows a window like this (once you have selected a date range).
You can drop down to view data by clicking on the green arrows. Alternatively, you can click on the printer icon on the bottom right and export the full list to Excel.
Date range
You can either enter dates manually or choose from the drop-down list to the right of the date fields.
Time range
Enter times here in 24 hour format (e.g.. 9:00 in the “from” field and 17:00 in the “to” field. Leaving these fields on 00:00:00 will calculate for the whole day.
To calculate totals, click the Show button. If there are a lot of transactions to evaluate, a progress bar will be shown.
Click the OK button to close the window when you are finished.
Backorder report
This report shows the backorders that have been placed for items. Backorders are made when there is insufficient stock to meet the requirements of an order placed by the customer. Information about the item code, item name, current stock, customer code, the backordered quantity (number of units, not packs) and the date of the backorder is displayed.
If you are running a backorder system this gives you a quick way to check if backordered items are now in stock so they can be supplied to customers.
Suggest price list additions
Note: the price list menu items are for those organisations that produce a price list or price indicator. (It is useful to call your publication a “price indicator”, as it implies the published price is a guide, and not a fixed price). You are asked to specify the number of transactions and the number of months (e.g. 2 transactions in the last 3 months) that would make an item eligible for inclusion in the price list. A search is performed using the criteria you enter, and a list of items is shown that meet the criteria but are marked as not being in your price list. You can double-click on items in the list and click their “price list” check box to add them to the price list.
Update price list
This item updates the catalogue or price list prices of items with prices from their current stock lines. All items have separate catalogue prices in each store and they are displayed on the Misc tab of an item's details window catalogue (see the 4.01.03. Items - Misc(ellaneous) tab page for details).
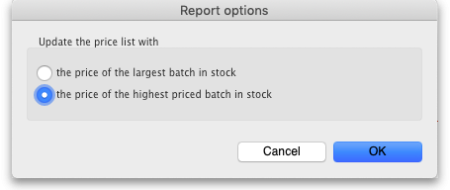
When you click on the Update price list option, the report options window is shown, allowing you to check what price is used:
- the price of the largest batch in stock: sets the price list (catalogue) price to the sell price of the batch with the largest number of units (pack size x number of packs) in stock.
- the price of the highest priced batch in stock: sets the price list (catalogue) price to the sell price of the batch with the highest price (i.e. highest sell price/batch pack size value) of all current batches in stock.
Note that in both options, the Catalogue pack size is also set to the pack size of the batch that is used to set the catalogue price.
Only items whose On price list check box is checked are updated. If no items have this checked then mSupply aill tell you so and the update won't run.
Note that if an item has no stock, then the price for that item will not be altered.
mSupply will show you the progress of the update and will also tell you when it is complete.
It is a good idea to run the “suggest price list additions” report before running this function.
Price list
Only items that are marked as included in the price list (Item > Misc tab) are placed in a report, whether or not you have any in stock.
If you wish to export to a text file, choose “save to disk” in the report options dialog that is shown.
The exported file has fields separated by tabs and records separated by returns. The field order is:
- Item
- pack size
- price.
If you wish to include different information, you can create a custom report to do this.
Location report
This report is available in version 1.96 and later.
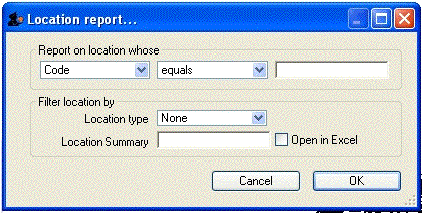
This report lists the location description, type, capacity, used volume and percentage available. Choosing this menu item shows you the location report filter options widnow as below:
The report may be restricted to certain locations by using specific search criteria. Choose either “Code” or “Volume” from left drop-down list is . The centre drop-down list allows you to choose a comparitor.
You have to make an appropriate entry on the right-hand field. Leaving the field blank means no filter will be applied.
Location type
It allows you to choose a location type. You can select the one from the drop-down list on the right side. The graphic of location type is shown below.
For example, you can specify the location type“COOL” to show only refrigerated locations.
Check the “open in Excel” checkbox if you wish to directly open the saved report in Excel (or any installed spreadsheet).
Click the OK button to run the report.
Manage reports
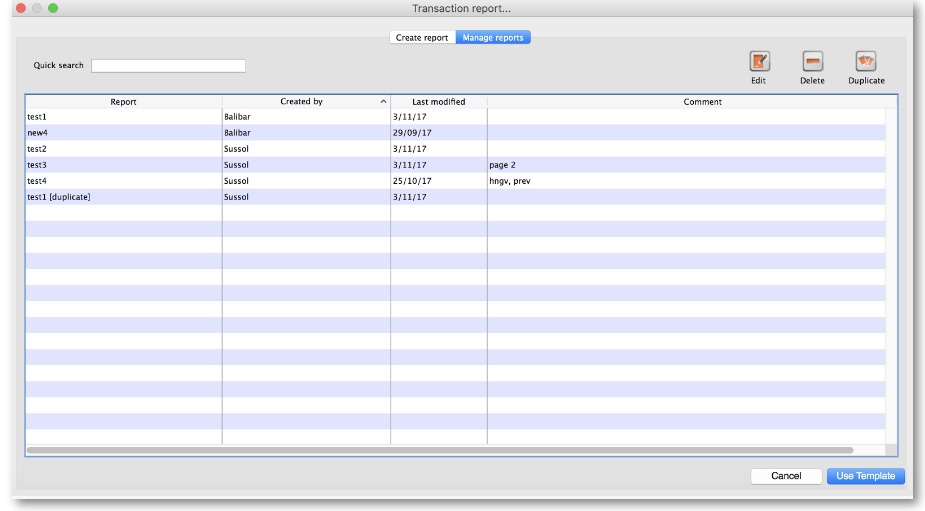
Choosing this item shows a list of built-in reports and any custom reports which have been designed:
The built-in reports may well be sufficient for your needs, but mSupply's versatility allows you to manage the reports to meet any specific requirements you have.
Options in the Report Management window:
Delete selected reports
Report(s) no longer required may be selected and deleted from mSupply
Duplicate report
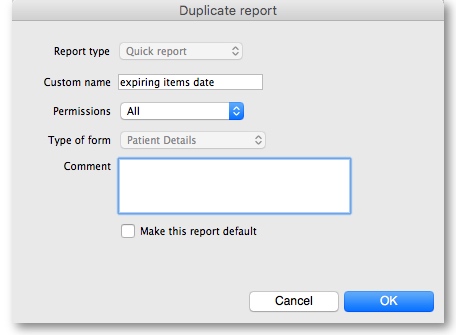
Should one of the built-in reports not quite meet your needs, you have the opportunity to create a duplicate of that report, and then modify it to meet your needs. The first step is to select the closely matching in-built report; in our example we'll use the expiring_items_date report, then click on the Duplicate report button;
the window that appears has already selected a name for your report, using the name of the in-built report prefixed by “ my_ ”; you may change this name should you wish. The Permissions drop down list allows you to specify users having access to your report; the options are All users , or Only me . Should you wish your report to become the default one rather than the in-built report, then check the Make default checkbox. When you click on OK, the report you have just created now appears at the foot of the list of reports from the item on the menu Report>Manage reports.
Edit report
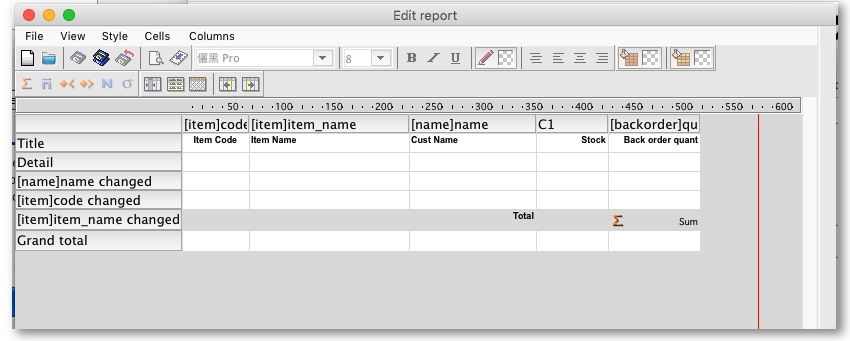
The editing of reports using the powerful editor has been extensively covered earlier in this section.
Using the report editor is complex, but it has the potential to produce a wealth of useful information. Contact Sustainable Solutions for a link to download a separate manual on the subject.
Note that in a multi-user installation, changes you make to a report will affect all users, so don't change a report without some forethought.
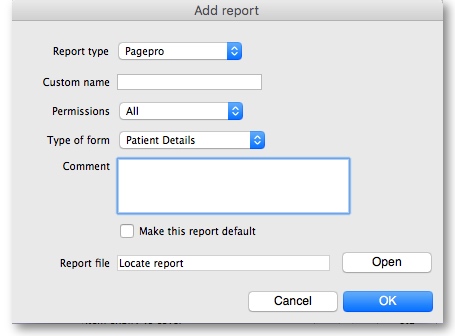
Add report
Revert selected reports
This button allows intrepid souls to save face by undoing the damage they have done to a particular report! The report that was installed with mSupply will be reloaded from the disk, and any changes you have made to the version stored with the data will be discarded.
Revert all
This button returns all in-built reports to their original state when you installed mSupply; exercise caution when using it. Custom reports which you have designed are not affected.
Save selected reports
All reports are automatically saved by mSupply in the default folder. There may be occasions when you wish to save one or more reports on a removable storage medium - e.g. a pen drive - and this button allows you to do this; a window appears allowing you to specify the location in which you wish to save the selected reports.
| Previous: 13.10. ATC and DDD code based reports | | Next: 13.12. Manage reports |
