This is an old revision of the document!
13.01. Report basics
Choose Report from the menus and this menu appears:

For some reports, the default setting includes all items, and as most stores will have several hundred items - maybe over 1,000 - reports on all items will, if printed, use a great deal of paper. If you must have a printout of your report, please exercise caution when selecting the criteria, and so avoid wasting paper.
Reports on purchasing are displayed when Purchasing is selected:

Reports on items and stock are displayed when Items and Stock is selected:

Reports on debtors and creditors are displayed when Debtors and Creditors is selected.

Many reports are available from the Reports page of the Navigator, as shown below:

Many of the reports present you with a window like this before printing the report:

This window allows you to set various options:
Report destinations
Printer: Select this option to display.the print window. The preview of the report can be displayed by turning on the print preview.
Open in Excel: If the Open in Excel box is checked, mSupply will immediately open the report as a spreadsheet in the spreadsheet application (MS Excel, OpenOffice/LibreOffice Calc etc.) you have installed on your computer.
- When this box is checked, you will first be asked to save the report. Once you have given it a name, the report will be saved, and then automatically opened in spreadsheet form.
- mSupply automatically detects any spreadsheet application you have installed on your computer (i.e. any application that is associated with .xls or .xlsx files). You do not have to set the location of this application.
Save to HTML file: If this option is selected, your report will be saved with extension “.html”. Hence, it can be opened by any web-browser or spreadsheet application on any platform or operating system.
Save as Text file: Your report will be saved to a file as a tab-delimited text file. (That is, a tab character between each column and a return character at the end of each row). After saving, you can open the file in a spreadsheet or word processing program.
Header and footer
You can choose what information will be displayed at the top and bottom of each page. The default report heading appears in the right hand Heading field and is automatically set according to the report you are printing: you can edit this as required and what is entered in this field is what will be printed as the report title. By default, the date will print on the left and the page number on the top right of each page.
If you have filled in a default header and footer in the Preferences, these will be displayed at the top left (for the header) and the bottom centre (for the footer)
Preview on screen before printing
This option turns on print preview. Note that you can also turn on print preview from the print window that is displayed after you click the OK button.
Output to Excel
Most reports can be output to an Excel file. This is particularly helpful if you are wanting to analyse a large amount of data.
As at July 2021, there are three methods of producing Excel reports from mSupply:
- Quick reports - Easiest to create, fastest to run, but least flexible in terms of formatting. mSupply users can create these - refer Custom reports
- SRP reports - More powerful than Quick reports
- XL Plugin reports - Most powerful in terms of formatting, but slowest in terms of operation.
Sometimes new, more powerful versions of existing reports have been created using the XL Plugin specifically for the purpose of analysis using pivot tables and filters. We have not wanted to delete the older reports, so we have kept them, and named the new report with [Excel] in the title.
Reports produced for Excel will sometimes not have the data formatted correctly, particularly, dates - refer to this.
Supervisor mode (reporting over mutiple stores)
If you wish to report over mutiple stores at once, you can be given permission to use Supervisor mode. When you are in this mode, report filter windows will have an additional store list added ot the window so that you can choose which stores' records are to be included in the report.
See the 25.01. Miscellaneous topics: Supervisor mode - all stores page for details.
| Previous: 13. Reports | | Next: 13.02. Stock and items reports |
13.15. SuperReport editor
- mSupply includes the SuperReport editor plugin.
- This gives almost unlimited customisation possibilities for forms and reports.
Due to security issues, report customisation using SuperReport can only be done by Sustainable Solutions. Contact us for more details.
| Previous: 13.14. Custom reports | | Next: 15. Barcode Scanning |
13.14. Custom reports
 Choosing this item brings up a window for creating a custom report:

The custom report window is displayed allowing you to create a report according to your own requirements using the Quick Report editor; once created you may save the form of the report in the custom reports folder for future use.
The window requires you to make three choices:
Report table
A list of tables on the left to choose which table (which type of records) you want to report on, e.g. Names, Items, etc.
As of version 1.6 there are two options for transaction lines. The “Transaction lines (Transaction query)” option allows you to search much faster on a large number of transaction lines. For example, if you are wanting to get the quantity of each item given to customers in a specific month, you would use this option.
Which records
A series of radio buttons to choose which records to examine
- All records
- New search (query), if you want to report on records meeting specific criteria. If chosen, you will be presented with the Query (search) editor, where you can build search statements to your heart's content! A short description of using the query editor is given below, and two example searches are later described. For a more comprehensive description, a range of books is available either in electronic or hard copy versions. Please email info@msupply.org.nz for more information.
- The “Current selection” is the group of records that were last displayed. For example, you can use the Item | View or edit item command quickly to find all items starting with “a”. When you click the OK button, the items in the list are the “current selection”. If you are not sure which records represent the current selection, you should click the “new search” radio button.
Report form
A drop down list displaying available options:
- New report
- After clicking the OK button you will be presented with the report editor where you can design a report. The report editor is somewhat complex, but time spent in learning how to use it is time well spent. It is a powerful and invaluable feature. A brief introduction together with designing two simple reports are given in Designing a Report below, and more details are available in training courses on using mSupply, and in publications available from Sustainable Solutions.
- If you want to save a report or search (query), you can save them on your hard disk, and retrieve them next time you run the report.
- If you save the report you have created in the Custom reports folder it will show up in the report form drop-down menu on future occasions when you choose custom report.
- The default location for saving your custom reports is My Documents\mSupply\custom reports; it is important to note here that any custom reports you have created should not be saved in the My Documents\mSupply\Reports folder, otherwise problems may arise.
- New label layout
- Presents you with the label editor, where you can design and save label layouts. These are useful for use with names for addressing envelopes, and with Items for making tags for labeling shelves in your warehouse.
- If you choose this option the “Order by” window will appear after a query. This allows you to sort the records into a particular order before printing labels. (In a nutshell: Drag fields from the list on the left to the list on the right to use them for sorting)
- Other items in the menu
- If you have saved any reports in the custom reports folder they will be listed here.
A list of the fields in each table, and what each field contains is given in section 24. Data Tables and Fields.
Using previously saved layout
Any report layouts which you have used previously, and saved, may be accessed by clicking on File >Open on the menu bar, and selecting the required layout.
Using the Query search editor
There are now many reports included in mSupply®, but there may still be occasions when you require a report that we have not included. The query editor is a bit daunting, but is very powerful and once you are familiar with its capabilities, your competence to access the precise information you may require from within the mSupply database will increase significantly.

When you open the Custom Report editor, it is ready to take input values for a simple single line query.
- The field to query. Choose this by clicking on the Find drop-down list which allows you to also choose fields from related tables. If you want to perform related queries, see note below.
- The Comparator. Choose the comparator from the list of fields by using the middle drop-down list.
- The Query value. Is entered in the third box. In the example above, the field chosen is an alphanumeric field (the item ID), so an entry area is displayed where you can enter text or a numeric value - in this instance the item code “amox” has been entered. Note that you can also use the “@” symbol as a wildcard in your query value to perform “contains” queries.
- The Conjunction. This does not apply to the first line of a query, but the second and any further lines need to start with a conjunction. Set the conjunction for the selected line by clicking the appropriate button in the left area of window ( And, Or or Except )
To add lines to a query, click the Add Line button.
Related queries: If you want to perform related queries, you need to know a little about the internal structure of mSupply data. Please contact us if you would like a diagram of the table layouts. A simple example of a related table is that each transaction line is related to a transaction (many to one relationship). The means that you can use the information stored in the transactions table (eg invoice date, number, status, etc.) to query transaction lines.
If you have created a complex query that you might wish to use on future occasions, you can save it to your hard disk and select it again using the Save and Load buttons in the window.
Once your completed query is entered, click the Query button to proceed.
For more detailed information on the Query search editor see: http://doc.4d.com/4Dv16R6/4D/16-R6/Query-editor.300-3561635.en.html
Designing a report
The designing of two custom report is now described:
- listing in alphabetical order the small number of items which may be supplied to staff or customers who wish to make a purchase without a prescription. These items have already been identified by making use of their User field 2, which contains the entry “Retail permitted”.
- listing the sources (suppliers) and the distribution (customers) of a particular batch number of an item - useful if a manufacturer recalls a particular batch of an item.
It is recommended that you study both examples, as features described in the first example will not be repeated in the second.
Report 1
Having selected Custom Report from the Reports page in the Navigator, you are presented with this window:
For our example report, we select the Items table, and to perform a New Search, using a new report form, so with these options selected, the window now looks like this:

Click OK, and the Query Editor window appears, as shown in the upper figure below; this is where you specify the criteria on which you wish to create your report - in our simple example, the single criterion is that there should be stock on hand of the item. In the lower window, we have specified this by:
- clicking on user_field_2 in the Available Fields panel on the left,
- clicking on contains in the Comparisons panel on the right, and
- entering “Retail” in the Value panel below.
You will see that the conditions we specified now appear in the upper panel - it's always a good idea to check here to confirm that the report will conform to your specified criteria.
Now click on the Query button in the lower right corner.

The Quick Report window appears; this is where you can design the layout of the report, and specify how you want the records to be sorted:

We'll start by taking a closer look at the Quick Report features.
There are two operation modes available which generate two specific types of reports: List and Cross table . Our examples are limited to the List mode. The Cross table mode will not be described.
In the List mode, reports typically display records as a list with break rows where calculations are performed.
When you create a quick report, you can specify the following:
- Columns that display fields or formulas, either from the current table or from related tables.
- Sort levels and order.
- Summary calculations.
- Display format.
- Text for labels.
- Formats for numeric and Boolean data.
- Font, font size, style, and justification for labels, summary calculations, and data.
- Background colours on a cell column or row basis.
- Borders, Page headers and footers.
- Presentation style from a wide range of templates.

- Master Table: This is the master table that will be used as a basis for generating the report. The fields of this table are displayed in the Fields list and the related fields will be displayed in relation to this table.
- Fields list: This list lets you select the fields to be inserted into the report by double-clicking or by drag and drop. You choose the type of display in the Field selection list located just above the area. Indexed fields appear in bold. You can also display and select the fields of related tables.
- Column dividers: These lines show the boundaries between columns of the report. They can be moved manually to enlarge or reduce the size of each column. Manual resizing deselects the Automatic Width option if it has been activated for the column concerned.
- Cells: A cell is the intersection of a row and a column.
- Scroll bars: You use the scroll bars to view parts of the quick report design that extend beyond the area of the quick report form.
- Sort list/Sort order display area: This list displays the fields of the report on which the sort will be carried out, as well as the sort order and whether it will be ascending or descending. Each field inserted into this list causes a sub-total row to be added in the Quick Report area.
- Quick Report area: This area lets you build your report by inserting fields using drag and drop, double-clicking or via the contextual menu; you can also adjust the width of the columns added, or delete breaks or formulas, define the colors and borders of cells, etc.

- Title row: This row displays the names of fields or formulas that have been inserted into the report. It is repeated for each page of the report. The Quick Report editor inserts field names by default, but you can modify the contents.
- Detail row: This row contains information drawn from each record and is repeated in the report for each record. You can associate a display format with it, depending on the type of data represented.
- Subtotal rows: These rows display intermediate calculations as well as the wording that is associated with them. A row is created for each sort order.
- Column data sources: These titles indicate the source of the data for each column.
Contextual menus
The Quick Report editor has contextual menus that make it easy to access certain row, column, and cell operations. Instead of making menu selections or working with the Cell or Column properties areas, you can perform certain operations by displaying a Quick Report contextual menu.
There are separate contextual menus for row, column, and cell operations.
To use a contextual menu:
- Position the pointer in a cell, a row title, or a column heading and hold down the right mouse button (on Windows) or press the Control key while clicking in the report area (MacOS).
A contextual menu appears. The commands in the contextual menu depend on where your pointer is (i.e., a row label, column heading, or cell). Also, menu commands that are inappropriate for the particular row, column, or cell are disabled.. - Choose the desired menu command:

Selecting rows, columns, and cells
When designing a Quick Report, you need to select rows, columns, and cells in the quick report form. A cell is the intersection of a row and a column.
- To select a row: - Click on the Title, Detail, Subtotal, or Grand total cells in the row label area.
- To select a column: - Click the Header row of a column.
- To select a cell: - Click the cell.
Adding and modifying text
You can add or modify text in the quick report form to label parts of the report. For example, if you requested summary calculations, you can label them by adding text to other cells in the Subtotal and Grand total rows.
You can add and modify text as follows:
- Edit the text that automatically appears in the Title row of the report,
- Insert text in empty cells of the Subtotal and Totals rows,
- Insert the value of a Subtotal field in the Subtotal rows,
- Specify the font, font size, justification, and style for any text that appears in the report.
Returning now to our first report, we want two columns only, the first listing the items in alphabetical order, and the second confirming the entry in User field 2. This is achieved by double clicking on item name in the list, and then to have the list sorted alphabetically, make sure item name remains highlighted, and click on the green arrow in the centre:

The second column in our report will show the present stock of each item, and the same procedure is followed; select the user_field_2 entry in the list, and double-click on it. You should be aware that items which are presently out of stock will not appear in the report.
The Quick Report window should now look like this:

The column widths can be adjusted as appropriate by positioning the cursor on the dividing line between the column headings, clicking and dragging to the left or right until the desired column width is obtained:
The vertical red line to the right of the columns indicates the right hand edge of the page as it will be printed, so to keep the report to single page width, columns should be positioned to the left of this line.
To preview on screen the report as it will be printed, click on File on the menu bar, and select Print Preview. Our example is very brief, but in reality, reports may run to two or more pages, and you can scroll through the pages of the report. This shows how our simple report will appear:

The printed report may benefit from shading or colouring of alternate rows, and this is achieved while the report format is being set. In the Quick Report editor, click on Detail to highlight the row, then click on the Alt.background colour icon, and a chart appears from which you can select the colour(s) of your choice.

For our report, pale yellow has been selected for the alternate row colour, and the report now has this appearance:

Adding report title
You may want to give your report a title to appear at the head of each page; this is achieved by clicking on File , then Header and Footer ; a window appears in which you can create and/or edit such a header You will most probably want the header to appear in the centre of the line, and in this case, type your entry into the Center panel in the Text Settings area; here you can also select the font of your choice, and features such as bold, underlined, etc.; these apply only to the header, not to the body of the report. A title has been added to our example:

To print the report, click on File on the menu bar, and select Generate and - provided that your printer is connected, online and loaded with paper - your report will be printed.
Report 2
The second report lists the sources (suppliers) and the distribution (customers) of a particular batch number of an item - useful if a manufacturer recalls a particular batch. The item chosen for our example is Metoclopramide 10mg tablets, the code for which is Metclp10, and the batch no.is BN1234
Having displayed the custom report window, this report requires us to select the trans_lines table, and to perform a New Search, using a new report form:

When the Query Editor window appears, expand the [Items] table, and once expanded, move down the list until code appears, and select it by clicking on it;the upper panel now shows [items]code , the default comparator is equal to ,and so to complete the line, move the cursor to the Value entry panel in the lower part of the window and enter 'metclp10'. Click on Add Line and accept the default conjunction And ; In the Available Fields panel, shrink the [Items] table, expand the [item_lines] table and select batch, accept the is equal to comparator, and enter 'BN1234' in the Value entry panel. You have now defined the criteria for the report, and the Query Editor window should look like this:

You are now ready to click on the Query button.
The Quick Report design window appears, with the Master Table - in this example the 'Transaction lines' table - expanded for selection of the fields required by our report; we'll be using four fields from the master table, namely item name, batch, pack and quantity; double-click on each of these in the list, and the Quick Report design window should appear as shown:

Don't be concerned at the order in which these fields appear in the report - we'll rearrange the order once all the fields have been selected. The fields we now need to add are in other tables; presently Master Table is selected ,and we need Related Tables , which is selected from the drop-down menu.

The table to access is the Transactions table, and the fields we require are Invoice number, type, and confirm date. Double-click on each, then expand the Names table, and double-click on [names]name.

All eight fields for the report are now selected, and we can arrange them in their required order. This is easily performed by selecting the column to be repositioned - we want the item name to be the first column, so we select it by clicking on the column heading, and move it by clicking on the 'Move Left' icon.

Select and move the columns using the 'Move Left' icon and the 'Move Right' icon until the column order from the left is:
- Item_name
- Batch
- Name
- Type
- Invoice_num
- Confirm_date
- Pack_size
- Quantity
The report will look better in landscape rather than portrait form, so click on File > Page Setup , and select landscape Once you have done this, you can view your report on screen by clicking on the 'Print preview' icon.
The next steps are :
- to sort the report
- to perform some simple calculations
- to display this information.
- to adjust the column widths
All these are simple to perform on the Custom Report window:

- Sorting the report. Drag and drop in the 'Sort order' panel the parameters required - in this example [Transactions]type and [Transactions] confirm_date.
- Performing calculations and displaying the information. We need to count the number of transactions, and display the totals involved. Observe the two rows added to the report annotated with the sort parameters followed by 'change'; these are the break points in the report, and the results of any calculations are displayed in these rows ….. here's how:
- position the cursor in the Invoice column on the [Transactions]type changed row
- click Cells on the menu, and check Count; we need to know how many customers have been supplied with this batch, so the Count icon is inserted in the row - it does not matter which column has the Count icon - for the time being it is entered in the 'Invoice' column, and the reason for this will soon become apparent.
- also required is the total quantity ordered, and the total quantity distributed, so the cell in the same row but in the Quantity is selected, and this time the Sum box is checked in the Cells drop down list.

- Column widths can be adjusted as described earlier, and having a look at the Print preview will enable appropriate widths to be defined.
The report should now appear something like this:

Only two tasks remain! It's not necessary to display the Invoice type, so this column may be hidden - right click on the column heading, and from the contextual Column menu, click on 'Hide'.
mSupply® by default enters the field name in the displayed column heading, but you can edit these column headings by double clicking on the cell in the 'Title' row, when an insertion point cursor appears and the current entry is highlighted; you can replace the default text with whatever you consider appropriate. This has been done in our example.
Finally, there is a large selection of presentation styles available, any of which can be applied to your report. On the menu bar, click on Style > Presentation. In our example, after defining a header for the report, we have opted for Report 1, giving our report the appearance you see below.

At some time in the future, you may wish to run your reports again. You should, therefore, save a copy of each report in the Custom Reports folder; this is performed by clicking on File on the menu bar, and selecting Save or Save as, giving the report a name, and saving it in the Custom Reports folder, or any other appropriate location of your choice. Then when you're ready to run the report next time, having specified your criteria in the Query Editor, when the Quick Report window first appears, click on File on the menu bar, select Open, and retrieve the desired report from its saved location, preview it and print it.
Using custom methods in quick report columns
Sometimes you will need to use a custom method in a column to extract data from a related table.
The following methods are available.
| Method | Description | Parameters |
|---|---|---|
| date_day_number_to_text | returns 1 for Sunday, 2 for Monday etc. | |
| qr_account_code_return | Returns the account code of an item | item_id |
| qr_flag_value_change | ||
| qr_get_currency | ||
| qr_get_current_patients_stat | ||
| qr_get_item_store_field | return value of field as text | 1:item.id 2:“price” or “is_in_catalogue” or “sellprice” |
| qr_get_location-from_key | ||
| qr_get_loc_from_key_new_process | ||
| qr_get_Name_code_from_key | ||
| qr_get_stockOnHand_from_itemKey | ||
| qr_get_store_name | ||
| qr_keep_accumulative_value | ||
| qr_ns_customer | ||
| qr_responsible_officer | ||
| qr_ship_method |
| Previous: 13.13. Saving report templates | | Next: 13.15. SuperReport editor |
13.02. Stock and items reports
When Reports > Items and Stock is chosen, a range of available reports are displayed; click on the one you require to select it:

Current stock

A report will be produced that lists each stock line that is currently showing stock greater than zero. Should you wish the report to include items/batches with zero stock, the box in the lower left needs to be checked.
Item filter
A “Item filter” allows you to enter the normal find item filter criteria to choose which items to include.
Random
A 'Randomly' filter allows you to enter a number of items that will be randomly chosen, and stocktake sheets for those items printed. This facilitates spot checking of your actual stock situation.
Additional options
Should you wish the report to be department specific, then that department should be selected from the drop down list of the departments which you have created.
Should you wish the report to give information on a particular location, then that location should be specified , selecting the appropriate operator of the three available in the drop down box alongside the Filter by actual stock location option.
Report format
You can choose from three formats:
- “Each batch shown separately” will also give you a column on the right where, having done a physical stocktake, you can enter the quantity that is actually in stock, allowing any corrections to be made in mSupply.
- “Total stock for each item” will not show individual batches, but the total quantity on hand of each item.
- “Each batch with prices” List the price of each batch in stock, with a total at the end of the report.
- “Donor reporting” select this to see donor information - see the 'Donor reporting' section below.
- “Items in rows, Donors in columns” shows eaxactly what it says in the report!
- “Items in rows, Stores in columns” shows a row for each with columns for each store. The cells contain the number of units of the item in each store. Must be run in supervisor mode (see the 26.01. Miscellaneous topics page for details).
The lines are reported alphabetically either by item name or shelf location, depending on what you have chosen in the “Sort report by” options
Donor reporting
mSupply provides the feature of printing the Donor name on the Current Stock report so that organisation donating the goods can be identified and tracked.

Stock on date
This report allows you to produce a report for the stock in your store on a particular date. The stock shown will be the stock at the END of the day. If you want to see the stock at the beginning of the day, choose the day before in the date selector.
You are shown a window like this:

Enter the date for which you wish to show the stock for.
Type of report
You have 3 options:
- Show items only: each item in your system will have a single entry with the total quantity on that date.
- Show items with batches: each batch, its expiry and batch number along with the quantity of stock will be shown.
- Show batches with summary: as 2, but every item has an aggregate line before the lines for each batch, showing the total quantity for all batches of the item. So it's a bit like a combination of 1 and 2.
- Monthly stock & consumption history (Excel): Each item has 3 rows showing its consumption, days it was in stock and its mean stock on hand for each month from the current month to the number of months in the past selected in the Months to look back field.
The Report on items whose box allows you to restrict the report to certain items only, using item properties or different categories as filters.
If custom stock fields are set to be used in the datafile then they will also be shown in filters beneath the item filters.
Open report in Excel
Check this checkbox to view the report directly in your chosen Spreadsheet program.
Show total stock value

This report is used to find the total stock value either for a particular department or all departments. The drop down menus allow customisation of your report by entering appropriate search criteria from the many options.
Check this checkbox to directly open the report in Excel rather than printing.
Graph: stock by item
This report shows a graph for an item or items showing the quantity of stock on hand for each day over a defined period.
Note that if you have allowed editing of confirm dates on transactions, mSupply's ability to calculate accurately the data used in this report may be affected.
Choosing this item from the menu displays this window:

Enter the date range, or select the required period from the drop down list, the items on which you wish to report, and appropriate filters, if any. Remember you can use the item flag field to select an ad hoc list of items to include in your report.
Clicking OK displays a window where you are shown a graph of the quantity in stock on each day for the first item that matched the criteria you entered.

This window also displays a list of items that were found. To display the graph for a different item, choose it from the list.
This report can be used as one of a set of key indicators for performance of a facility by comparing days out-of-stock of key items from one year to the next.
Graph: total stock
The total stock graph report allows you to view the value of your stock over a desired period of time. When you choose total stock graph, you are able to enter the required period which you would like to view:
Select OK and a graphical stock history report showing stock value will be displayed

Item list

This report allows you to print a list of you items in certain formats.
There are 3 options in the Report form to use drop down list:
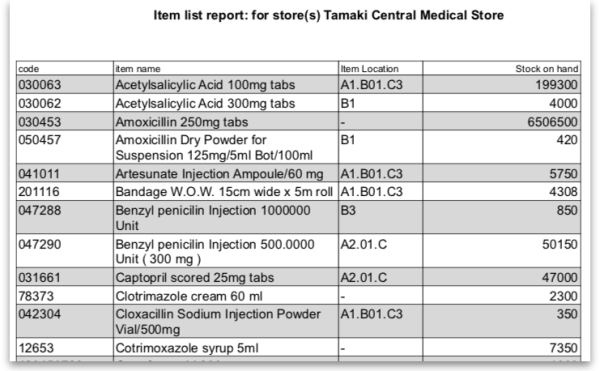
- Code, Name and Shelf Location: Shows exactly what is says with current stock on hand:
- Code, Name, Shelf Location with Item Long Description: Shows the same as the previous one but includes the Item long description.
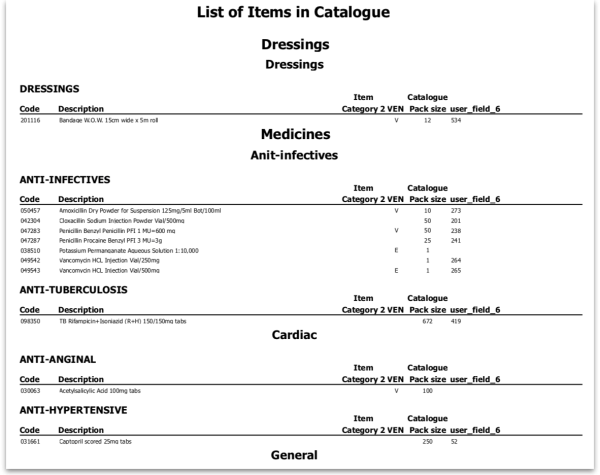
- List of items in Catalogue: Shows item details including the catalogue pack size and item custom field 6 value all separated out by the hierarchical item category 1. Looks like this:


Local / remote report
This option will only show “local data” as an option unless you purchase a web services enabled version of mSupply, in which case you can view reports from remote locations running mSupply. Contact us for more information.
Items out of stock
Selecting this report displays this window:

Specify your required options from the drop down lists;
Days out of stock
Selecting this report displays this window:

Specify your required options from the drop down lists; the desired period may be identified either by entering dates in the From and To fields, or by using the drop down list to the right.
Clicking ok will generate a report like the one below:

Clicking the Complex find button opens the Query Editor, allowing you to enter specific criteria relating to your search.
You may also specify what level in percentage terms of the maximum stock should be considered as being “out of stock..” Here's an example over 1 month:
| Day of month | 1 | 2 | 3 | 4 | 5 | 6 | 7 | 8 | 9 | 10 | 11 | 12 | 13 | 14 | 15 | 16 | 17 | 18 | 19 | 20 | 21 | 22 | 23 | 24 | 25 | 26 | 27 | 28 | 29 | 30 |
|---|---|---|---|---|---|---|---|---|---|---|---|---|---|---|---|---|---|---|---|---|---|---|---|---|---|---|---|---|---|---|
| stock on hand | 20000 | 20000 | 20000 | 2000 | 1000 | 500 | 300 | 200 | 30000 | 25200 | 20200 | 18000 | 18000 | 18000 | 10000 | 5000 | 5000 | 2000 | 2000 | 800 | 800 | 20000 | 20000 | 20000 | 20000 | 20000 | 20000 | 20000 | 20000 | 20000 |
| Out of stock |  | | | This day had maximum stock. 5% of 30000=1500 | | | ||||||||||||||||||||||||
| Note the 5% stock out level = 1500 | ||||||||||||||||||||||||||||||
Item usage
The Item usage report gives you a breakdown of item usage for the last few months, with summaries for the last 2 years, It also includes stock on hand and stock on backorder for each item in the report.
The report produced is very useful for forecasting or for seeing a list of items that need to be ordered.
When you choose the menu item you are shown a window like this:

You can choose the type of report you want to run from the drop-down menu. Select the Item usage [Excel] report to create an Excel report.

This menu also includes an item usage report, a suggested ordering amount report, or to auto generate a tender from the drop-down list at the top. This form is used for all 7 functions. (Note that the Item usage report with pending purchase order option will show you item usage with details of items currently on order and their expected date of delivery).
If you want to report on all items, leave the item name field blank:

otherwise enter an item name or code. For example, to report on amoxycillin stocks, you could enter “amox” into the field.
Depending on the entry in the first field, further options are available in the following two fields, but these will vary according to the entry in the first field. Among the options, he first field allows you to make your selection from the names given to custom item fields in the Preferences if this feature has been used.

If you wish to use shelf locations, then select the shelf location option and specify the desired shelf.
You can use the drop-down list to find Items with a particular code, or to use the values you have entered into one of the custom user fields. If this isn't powerful enough, use the complex find button to display the full query editor.
Click the refresh button  to calculate the number of items these basic parameters will find. This screenshot shows that 17 items meet the parameter specified, i.e. items whose names begin with 'pro';

Only include items whose stock cover is less than...
If you want only to report on items whose stock is low, enter the threshold for days of stock on hand into the second field. For example, entering 90 into this field will only include items in the report whose stock is not sufficient to cover average usage for the next 90 days.
The default of 0 (zero) in this field will include all items with any amount of stock remaining.
Include items with no usage in the last 12 months
If this box is checked, items with no usage over the last year will be included. This will include items for which there are no transactions at all. This check box will have no effect if the previous “days cover” field is filled in, as an item with no usage will have “infinite” cover- any stock you do have is going to last you forever!
Include usage for build ingredients
If you manufacture items, you can choose whether the use of ingredient lines in manufacturing is included in the report or not.
Open report in Excel
Checking this box opens the report in Excel (or any installed spreadsheet program).
Note: If you chose the Item usage [Excel] report from the dropdown list, the Excel box will already be checked.
If you want to save the report in Excel (or any installed spreadsheet program), choose File > Save as.
Item usage report preview

Suggested ordering report
This report shows usage data, months cover of stock remaining and a suggested quantity to order for each item. The Purchaser can review this report to make a final decision on how much stock to order.
From the Item usage report dialogue box, select the Suggested ordering report option from the drop-down menu. Alternatively, select the Suggested ordering [Excel] report to create an Excel report:


Note the extra options for including item usage when calculating item ordering quantities. Also note the option to include ordering for build items. See item builds for more on built items.
Open report in Excel
Checking this box opens the report in Excel (or any installed spreadsheet program).
Note: If you chose the Suggested ordering [Excel] report from the dropdown list, the Excel box will already be checked.
If you want to save the report in Excel (or any installed spreadsheet program), choose File > Save as.
Suggested ordering report preview

Item usage with outstanding purchase orders
The window that appears when you choose this report is the same as the previous one; with exactly the same options available; the report produced differs only in that any lines having outstanding Purchase Orders have the relevant details of the Purchase Order displayed.
Item slow movers
The Item slow movers report shows all items that have more than a specified number of months worth of stock. TIt is very useful for managing under-performing inventory and allows you to quickly to obtain a list of items where a reduction in stock might be desirable.
You will be shown a window to enter the report options:

Enter your search criteria in the top section.
Item name field
- If you want a report for all items, leave this field blank. Otherwise enter some text to reduce the report to just a few items (e.g. entering “am” will produce a report of just the items whose name starts with “am” (Amitriptylline, Amoxycillin, etc)
Category and department
- Use the drop down boxes as appropriate to select Category and/or Department if required.
Base analysis on X months of usage data
This is the number of months of usage data (working back in time from the current date) to use to calculate the AMC (Average Monthly Consumption). The months of stock on hand is then calculated as current stock/AMC.
Report on items that have more than X months stock on hand
Only items that have stock that will last this or a greater number of months will be included in the report. Those with less stock will not be included.
You can check the Open report in Excel checkbox to open the report in Excel, or any installed spreadsheet application.
When you click on the OK button you are taken to the printing options window:

There are two versions of this report, the standard one or one showing the individual batches of each item. Choose the one you want using the Form to use drop down list.
The standard report looks like this:

The one with batches looks like this:

Please note that:
- The months of stock is calculated for all batches together, not for individual batches.
- The maximum months of stock shown is 1200 i.e. 100 years! This figure will be shown for all items that have no consumption as well as those for which you genuinely have that much stock.
Expired stock
This is a customised report only available for few of our clients.

This report shows the stock that expired while it was on your shelves between the dates you seec in the options. It includes current stock that expired between the dates selected and also stock on confirmed customer invoices and inventory adjustment-reduces that was expired when it was put on those transactions (so if you removed stock from the store after it had expired, that is also included as stock that expired on the shelf).
Donor and custom stock fields are included as filter options if they are turned on in the current store.
The report looks like this when exported to Excel:

Expiring items

This report will ask you to enter a date, and will then give a report of all item lines in stock whose expiry date is before the date you have entered.
For example, entering 31/8/11 will display all items with expiry dates before 31st August 2011 (Enter the date in short format in the way your computer is set to handle dates (DD/MM/YY or MM/DD/YY or YY/MM/DD).
You can additionally filter the stock by the location type or the actual location in the warehouse. This is helpful for reporting on items in certain sections of your warehouse.
Three report type options are offered; select as appropriate. You may refine the search by using the Name filter and/or the Item filter..
Donor reporting
mSupply provides the feature of printing the Donor name on the Expiring Items report so that the organisation donating the goods can be identified and tracked. This can help with disposing of or returning goods to the Donor.

Expiring items vs. cover
The Expiring items vs. cover report shows the number of months of cover for items you have in your store. The cover calculation uses the last 12 months of usage data to calculate the AMC which is used to determine months of cover.

Many filters may be applied in the drop down lists, which are the same as described under Item usage… above.
Note that If the field you are searching is a boolean field, e.g.Essential Drug List, “false” appears as the default entry, which you may change to “true”.
Cover calculation
This allows the user to include or exclude specific categories to be used in calculating coverage. Clicking the magnifying glass to the right lists categories to be chosen.
If you wish mSupply to remember the criteria which you have entered, click on the paperclip icon, and your selections will appear the next time you open the report.
Once you have selected your required criteria, click on the Refresh icon to show the number of items which match your criteria, and which will, therefore, feature in the report.
Item ledger

Ledger entries may be viewed in this report; different formats of report are available in addition to several filter options from the drop down lists, so the report may be designed to meet your specific requirements.

The Purchases by suppliers report relates stock received to purchase orders made and looks like this:

The Stock movement with stores report looks like this:

| Previous: 13.01. Report basics | | Next: 13.03. Transaction reports |
13.10. ATC and DDD code based reports
ATCs and DDDs
“ATC” stands for “Anatomical, Therapeutic, Chemical”, and is a method of classifying chemical entities, and identifying them by category.
“DDD” stands for “Defined Daily Dose”, and provides a means of comparing the utilisation of different drugs in a meaningful way. - e.g. if a dispensary has issued 10,000 x doxycycline 100mg and 20,000 x amoxycillin 250mg, a greater number of amoxycillin capsules has been used; but according to the DDD method, a greater number of patients have received doxyxcycline.
Thanks to the help of the WHO Collaborating Centre on Drug Statistics and Methodology, we are able to offer a starting drugs file with their codes; we have plans (not yet implemented) to maintain on our website an up-to-date list of ATC and DDD codes for essential drugs.
Reports using ATC and DDD codes
mSupply is designed for the ATC code to be entered in the Category field for each item, and is then able to report on supply transactions, giving a breakdown according to the different levels of the ATC code.
The DDD Factor field is intended to store the item's number of dose units in its DDD; for example, if an item's DDD is 1,000mg, and the supply is made using 250mg units, the DDD factor is 4. When designing a report, the total quantity of this item used should be divided by the DDD factor to obtain the number of DDDs supplied.
Should you wish to store an item's DDD value (1,000mg in the above example), it is suggested that you record it in one of the available user fields. The DDD value should not be recorded in mSupply's DDD factor field
The category analysis report is designed to be used in conjunction with the “category” field and the “DDD factor” field for each item.

When you produce a report, only some simple criteria are entered in the form. It is a simple matter to create reports giving, for example:
- A level one ATC summary for all items supplied to a specific hospital during a 12 month period
- A level two ATC summary for all items in ATC category “J” supplied to customers who are coded as “h” (for hospital) for a particular month.
- A level three ATC summary for all essential drugs supplied to all customers for a particular quarter.
The report provides you with the number of DDDs supplied for each category at the level requested, presuming you have “DDD factor” values entered correctly. Only the totals for each category are shown (not each individual transaction). The report may be printed, or exported for use in another application.
Let's run through the different options in the window… summary level…- enter the summary level. The category field is then evaluated based on the ATC coding system. Note that the code is “broken down” as follows
| level | position |
| 1 | character 1 (A-Z) |
| 2 | characters 2 & 3 (01-99) |
| 3 | character 4 (A-Z) |
| 4 | character 5 (A-Z) |
| 5 | characters 6 & 7 (01-99) |
So, for example the code for “caffeine” is N06BC01. “N” is the level 1 code, “06” the level 2 code, “B” the level three code, “C” the level four code, and “01” the level 5 code.
Note that if you choose “level 3”, you will also be shown the summary values for “level 1” and “level 2” as well.
Which type of item?
You can report on all items, or you can report on just a certain category. For example, you can enter “J” here to report only on items whose ATC code starts with “J”. Note that you need to set the summary level to “level 2” or your report will only report the total for category “J” without any further breakdown of data.
Only report on essential drugs
Check this if you only want to analyze items whose essential drug check box is checked.
Transaction type?
- Normally we will be interested in supply to customers. However, we might also be interested in “what percentage of purchases from IDA (a supplier) are aniti-infectives?”, in which case we would click on the “items received from suppliers”
Date range...
Enter a starting date and an ending date. Only transactions whose confirm date was within the range will be analyzed. The default range is the last 90 days. Note that the dates you enter are included in the range (that is the “from” date is “on or after” and the “to” date is “on or before”)
Which customers/suppliers...
Leave this value blank to report for all customers. Otherwise, choose “code” or “category” from the popup menu, and the appropriate comparison from the second popup menu. For example, if you want to report on a certain group of hospitals, you could enter those hospitals as having a category “h”, and then report on “names whose category starts with 'h'”
| Previous: 13.09. Customer ordered shortfall report | | Next: 13.11. Other reports |
13.09. Customer ordered shortfall report
When you choose Report> transactions and then select Customer ordered short fall report , the transaction report like the one below will be produced. This report is used only for sales to customers.
For this report to make sense, make sure that:
- The Allow placeholder lines on customer invoices preference is checked
- The Delete placeholder lines when confirming invoices preference is un-checked
![]()
From the report window, select the desired parameters and click OK . An example report is shown below.

Previous: ATC based reports Next: Purchasing
Setting up mSupply to use the customer ordered shortfall report
For this report to be used, you need to do the following
- Choose File > Preferences > Invoices2 and ensure “Delete placeholder lines when confirming invoices” is not checked.
- Staff must enter requested amounts on invoices as placeholder lines.
- For example, a customer orders 1000 x Paracetamol syrup 60ml. You have 800 in stock, so you add 800 to the invoice, and you also add a placeholder line for 200 bottles.
You need to decide whether to (and if yes, how to) use the backorder system. If customers can rely on you to record shortfalls as backorders, then they will no need to re-order the shortfall in subsequent ordering cycles, as they know you will deliver it when available.
In our experience, general custom and practice in places that use mSupply is for facilities to simply re-order stock that wasn't delivered 'last' time. In this context, it would not be useful to turn the backorder system on.
| Previous: 13.08. Dashboard | | Next: 13.10. ATC and DDD code based reports |
13.04. Purchasing reports
Purchasing reports (focused on what you have ordered and what you have received and what you want to order) are available at Report > Purchasing. The following report types are available:

The first 2 options contain several different reports (see below). Select the required report type by clicking on it.
Purchase orders

Types of report
There are seven reports currently available:

- The Ordered Item Report will list items that are on Purchase Orders according to criteria specified.
- The Goods Received date vs Order date report lists each Goods Receipt for a particular Purchase Order and the number of lines received, then follows with details of the number of lines and date of the original Purchase Order, as in the example below. This is useful for tracking supplier delivery performance.

Note that the number of lines received may not match the number ordered as a single Purchase Order line may be supplied in split deliveries, as in example shown, or an ordered line may not be supplied at all.
- The Goods Received date vs Order date - Show items report.
- The Outstanding Purchase Order Lines report, which will display all Purchase Order lines for Purchase Orders provided that
(1.) delivery is incomplete, and
(2.) the Purchase Order has a Confirmed (“cn”) status. - Note that Purchase Orders whose status is Finalised (“fn”) will be ignored when producing this particular report.
- The Goods Received date vs Order date - show Delivery days report shows the number of days taken to deliver items.
- The Purchase order vs goods received broken down by batches report shows the dates particular batches were received.
- The Purchase order cashflow planning report shows you the values and times of expected deliveries so that you can plan when money needs to be available to pay for them.
Date range and date type
A date option, for selecting which items/purchase orders to include in the report must be selected; options are:
- creation date - the date purchase orders were created
- sent date - the date purchase orders were confirmed
- expected delivery - the expected date of delivery for items
- actual delivery - the actual date that items were delivered
The report will include items/purchase orders with the selected type of date falling between two specified dates entered in the From and To fields. The drop-down list on the right affords many quick-choose preset date range options such as “today”, “yesterday”, “this week”, “last week”, “this month” etc.
Report on names...
The report may be confined to suppliers meeting specific criteria by selecting one of several supplier properties (“Name”, “Name code”, “analysis”, “category”, “Price code” etc.) in the left dropdown list, “equals”, “starts with” or “contains” in the centre dropdown list and making an appropriate entry in the field on the right. If this field is left blank, the report will include purchase orders from all suppliers within the chosen date range.
Report on items...
Similarly the report may be confined to items meeting specific criteria; you choose an item's property to filter on in the left dropdown list followed by the comparator in the centre dropdown list and finally making an appropriate entry is made in the field on the right. Again, leaving this field blank will produce a report on all items within the chosen date range.
You can also report on items that have a certain category and/or department. By default these options are set to “Don't care”, which means the item categories and departments will be ignored.
Note that only reports that report on invoice lines will produce meaningful results when you choose item criteria. Reports that report on whole transactions (e.g. “Each invoice grouped by name” or “Each invoice grouped by date”) will not produce meaningful data, as any one invoice can contain multiple items. Choose reports that report on invoice lines (e.g. “Each invoice line by item” or “Totals for each item grouped by month”) for these filters to have an effect.
Report on purchase orders...
In the same way, you can also filter your reports on properties of the purchase orders involved: category, status and both purchase order custom fields. For more information on purchase order categories see here.
Please note there is also a Purchases by suppliers report that relates stock received to purchase orders made. This is one of the item ledger type reports and details can be foiund on the 13.02. Stock and items reports page.
Purchases

This report finds all purchasing transactions over a certain value within a specified time period
You should enter:
- The date range of transactions on which to report
- Four filters are available to refine the report - a name filter, and three item filters; all are optionally and will be ignored if nothing is entered in the textbox or drop down lists are left at “Don't care”.
- The value of a transaction line above which the report will cover.
It may be good for your organisation to have a purchasing policy that stipulates that transactions over a certain value must be authorised by a second party (that is, someone other than the purchaser). This report allows you to monitor such a policy easily.
Suggested order quantities
Use this report for mSupply to analyse your current stock and, based upon a required number of months of stock cover which you enter, suggest how much of each stock item you should consider ordering.
There are currently 3 options for the suggested order quantities report: Suggested ordering report, Suggested order quantities with prices and price extension (see below for details on this report and its additional option) and Suggested ordering [Excel] report. They all have the same options as defined below but the last two will run much more quickly than the first one, even if the first one is exported to Excel. This is a temporary situation: the first option will be removed in a later version of mSupply and the last two will be the only options available.
Quantification
Some logic behind the calculations involved in this report is described in detail on the 6.01. Ordering stock from suppliers page.
As of version 7.15, mSupply supports a wide array of options for calculating forecast Average Monthly Consumption (AMC), which is then used to forecast needs and then to calculate a requested order quantity.
The options are:
Don't Adjust AMC
This has been the default in mSupply up until this point. The historic consumption is summed up for the number of months specified in the lookback field, and divided by the number of months. This works well if the item was fully stocked for the whole time. This method results in the forecast AMC being too low if stock was low or zero in the past.
Consumption vs Distribution vs Issuance: Stock may be consumed within the facility for the care of patients, or distributed to other facilities, but for the purposes of the supply chain, whatever a store issues out of stock is 'consumption', and these terms all have the same meaning. In mSupply, we use the term Consumption.
Adjust by % of days out of stock
This method takes each historic month's consumption, and adjusts it for the number of days in the month the item was out of stock. We multiply the consumption for the month by (Days in month divided by Days in stock) to get an Adjusted AMC Take this example for a single month where Item B had nil stock for a period of time:
- Item B was in stock for 10 days in the month
- Its historic consumption was 500
- The adjusted AMC is 500 x 31 / 10 = 1,550
Only consider fully stocked months
Here, we are attempting to address months with low stock by excluding them from our calculations, rather than adjusting their consumption.
There is a field shown % of days in stock to be considered fully stocked that defaults to 90%
For this method to work, you need to set the lookback period long enough that mSupply will be able to find enough fully stocked months to run the calculation. You can also include more low stock months by setting the % of days in stock to be considered fully stocked field to say) 50%. Do this with caution, as there is a real danger that it will result in an underestimate of AMC.
mSupply's better algorithm
We've tried to come up with a better algorithm here by:
- ignoring months that are in stock for < 33% of days. That is, if the item was in stock for less than 10 days in the month, the consumption on those days is too erratic to draw conclusions about what the consumption for the whole month would have been.
- For months with stock >= 33% of days, Multiply the consumption for the month by √(Days in month/Days in stock) to get adjusted AMC. This adjusts the consumption up due to being out of stock, but by a factor up to 1.7 - so not as big an adjustment as the “Adjust by % of days out of stock” method.
- We also ignore months where the mean stock on hand is less than “% of typical AMC that stock level is considered compromised:” value you enter. This is a bit complicated, but here's an example:
- Consider Item A - we have set the “when we calculate consumption there are 3 months that were “fully stocked” - those three months give us an AMC of 1500 per month.
- Now, there's another month that was fully stocked (as in, on all 31 days in the month, there was some stock on hand.
- But it turns out that the average stock on hand was only 50 - clearly they could never have had “normal” consumption, although they did have stock - if the cut-off is set to 100%, we're saying “ignore this month unless the average stock on hand was 1500 - in this case it's 50, so this month isn't used in the AMC calculations
We then sum the adjusted consumption for all the eligible months & divide by the number eligible months to get the best forecast AMC eva 
Here's a diagram:
Let's take an example of how this is done:
Lets say we are using:

Step 1: First we are adjusting by % days in stock to be considered fully stocked. This calculation will be used in Step 2 to calculate the typical AMC. So if this is set as 90%, only months with ≥90% stock will be considered. In this case, Nov 2023 (202311) and Oct 2023 (202310) are excluded as it is less than 90%.

Step 2: We then calculate the typical AMC which excludes the months Nov 2023 (202311) and Oct 2023 (202310) from step 1. To do this, we use: (Total consumption of only months included in Step 1)/(Number months usage basis) = 100 / 7.8 = 12.82. Red coloured boxes indicate exclusion. (Note: We have 7 full months, and 0.8 of a month due to July 2024 (202407) as 26 days is 0.8.

Step 3: Next there is an automatic exclusion for days of low stock ≥33% in the month. Note: This is automatic and is not set by the user. In the example, this is Nov 2023 (202311) as it is the only month with less than 33% days in stock in the month.
Step 4: Now we consider the criteria of “100% of typical AMC that stock level is considered compromised” which we entered in the Report options. Since this is set as 100% by us, we now take the typical AMC (12.82) and check the Mean SOH of each month to make sure that this is equal or higher than 12.82. If stock level is not higher than 12.82, that month will be excluded from the Adjusted AMC calculation (Step 5). Note: If we had selected 90% of typical AMC to be considered compromised, this means we will be looking at 90% stock or more of the typical AMC (12.82) and anything less than this will be excluded.
To now obtain the number of months to be considered for the adjusted AMC: We will exclude the 33% low stock month from Step 3. We will exclude any months with (x)% typical AMC stock level that is considered compromised (which in this case, there is none). We will be including the month with 11 days in stock however, as it is more than the 33% exclusion step and the first step where it was excluded was just for calculating what months to use for typical AMC.
From the example, we will now have 8.8 months that we will be considering for the Adjusted AMC.

Step 5: We can now calculate the Adjusted AMC with the formula: Square root[(Days in month)/(Days in the stock)] * Consumption We check this individually for each month that has not been excluded. So, if the “Days in month” = “Days in Stock”, the square root of this = 1. In Dec 2023 (202312) = 1 x 100 (consumption) = 100. In Oct 2023 (202310) = Squareroot(31/11) = 1.6787. Then 1.6787 x 100 (consumption) = 167.87.
Add these together: 100 + 167.87 = 267.87 total for all included months that we will use to calculate adjusted AMC.
Step 6: For the Adjusted AMC = 267.87/8.8 months = 30.34 units per month.
Steps Summarised:
Step 1: Adjusting by % Days in Stock
- Set threshold for fully stocked (e.g., 90%)
- Exclude months with < 90% stock
Step 2: Calculate Typical AMC
- Use months not excluded in Step 1
- Calculate Typical AMC = (Total consumption of only months included in Step 1)/(Number months usage basis)
Step 3: Automatic Exclusion for Low Stock
- Exclude months with < 33% days in stock
Step 4: Compromised Stock Level Check
- Set threshold (e.g., 100% of typical AMC)
- Exclude months below threshold
Step 5: Calculate Adjusted AMC
- Apply formula to each included month = Square root[(Days in month)/(Days in stock)] * Consumption
- Sum the results
Step 6: Final Adjusted AMC Calculation
- Divide total consumption by number of months
- Calculate Adjusted AMC
Note: If all months have been excluded due to the first or second exclusion criteria, then the typical AMC calculation will automatically be used instead.
Report options
You'll see this window:

If you want to report on all items, leave the item name field blank, otherwise enter an item name or code. For example, to report on amoxycillin stocks, you could enter “amox” into the field.
 The drop down list, after the item name and code choices, lists several other fields, including any user defined fields, where the names that you have defined for custom item fields in the Preferences are displayed.
If you wish to use item categories, then use the Item category list to choose the one on which you want to report.
You can use the drop-down list to find Items with a particular code, or to use the values you have entered into one of the custom user fields. If this isn't powerful enough, use the Complex Find button to display the full query editor.
Click on the refresh button (double orange arrows) to show the number of items these basic parameters will find.
Only include items whose stock cover is less than…: If you want to report only on items whose stock is low, enter the threshold for days of stock on hand into the second field. For example, entering 90 into this field will only include items in the report whose stock is not sufficient to cover average usage for the next 90 days.
Enter “0” (zero) for this field to report on items with any amount of stock remaining.
Expected delivery: Enter an appropriate date that you expect the stock to arrive with you based on previous delivery times.
Include usage for build ingredients: If you manufacture items, you can choose whether the use of ingredient lines in manufacturing is included in the report or not.
Basis of analysis: Enter the number of months of data (form the current date) mSupply should use to calculate your consumption.
Exclude transfers from calculations: Check this box if you wish transfers within your organisation to be excluded from the calculations.
Include items with no usage in the last 12 months: If this box is checked, items which have not been used over the last year will be included. This check box will have no effect if the previous “days cover” field is filled in, as an item with no usage will have “infinite” cover- any stock you do have is going to last you forever
Months stock required: In this field, enter the number of months stock cover you want to have available. The report will automatically take into account any stock you already have, so all you need to do is enter how many months cover you want.
AMC Adjustment for Out of Stock: See the “Quantification” discussion above on the different options available.
Exclude stock that will expire within 3 months of projected consumption date a checkbox that allows you to accurately predict the amount of stock that is likely to be wasted due to expiry and current consumption rate. In this current example, mSupply will only aim to distribute stock if the expiry is more than 3 months away. This updated feature is only available in mSupply v7.12 or later.
This topic is huge so it may be worth reading this topic Stock wastage prediction for ordering
Open report in Excel: Checking this box opens Excel (or any other installed spreadsheet application) and displays the report as a spreadsheet. If you want to save the report, choose File > Save as… in your spreadsheet application.
Report output
A typical `Suggested Order` report will look something like below.

Definitions of each column after item properties:
- Stock on hand : Total quantity of stock currently available in your inventory
- Expiring stock : Calculated by (Total stock that is set to expire) - (Daily stock usage [which is derived from the AMC e.g., AMC / 30 days if 30 days in the month]). The amount of expiring stock to be accounted for is selected in the reports option:

- Effective SOH : Calculated by ('Stock on hand') - ('Expiring stock'). This is the usable stock available.
- Backorder : Quantity of stock that has been ordered by customers but not yet fulfilled due to insufficient stock.
- Stock on order : Quantity of stock that has been ordered from suppliers and is expected to arrive but not yet received.
- AMC 12 months : Average quantity of stock used per month over the last 12 months.
- AMC 24 months: Average quantity of stock used per month over the last 24 months.
- Monthly usage for the last (x) months : Calculated by ('Total consumption for the last (x) months of usage data') / ('(x) months of usage data'). This value is set by the user in the Report options:

- Number of months considered for adjusted AMC : After the AMC adjustment is made (and months with low stock has been excluded), this value indicates the number of months that have been included for calculating the adjusted AMC. This value is derived from whichever formula has been chosen in the “AMC Adjustment for out of stock”:

- Adjusted AMC : This adjusted value is based on the formula selected in the Report options:

- Number of months in stock : Calculated by ('Effective SOH') / ('Adjusted AMC'). This gives the number of months the current stock will last based on adjusted consumption rates.
- Ordered Quantity used : This is how much of the stock you have ordered that you will actually need to use, based on how much you use each day and how much stock you already have (Note: forecast calculation will affect this). This is determined by:
- Calculate the “usage per day of stock” = AMC / 30.4375
- Multiply “usage per day of stock” with the “total number of days in your months stock required” to get “Total usage required” = Usage per day of stock x Total number of days in your months stock required
- Calculate your “Future stock on hand” = Stock on order + Effective SOH - Backorder
- Subtract “Total usage required” from “Future stock on hand” to get the “Net stock difference to be used” = Total usage required - Future stock on hand.
- This value (“Net stock difference to be used”) now determines the “Ordered Quantity used”.
- If the value is a negative value and there is “Stock on order”, add the “Net stock difference to be used” with “Stock on order” = “Net stock difference to be used” + “Stock on order”
- If the value is a positive value and there is “Stock on order”, if “Net stock difference to be used” is greater than “Stock on order”, the “Ordered Quantity used” will be the same value as the “Stock on order” as all the stock on order will be used up.
- Suggested Order calculated by:
- If expected delivery date has not been adjusted: ('Months stock required' x 'Adjusted AMC') - ('Effective SOH' - 'Stock on order') + 'Backorder'.
- If expected delivery date has been adjusted, this will be accounted for as it will only look at the stock required from date of expected delivery to the end of months stock required:
- Usage per day = Adjusted AMC/30.4375 (which is from 365.25/12 which is days in the full year)
- Suggested order quantity = Usage per day x Days needed (which is 'Expected delivery date' - End date of the 'Months stock required', or days needed in total - days of lead time) - ('Effective SOH' - 'Stock on order') + 'Backorder'
- This determines the quantity of stock that needs to be ordered to maintain the desired inventory levels after considering current stock, back orders, and stock already on order.
- Note: if you are using the “Minimum stock” function, the suggested order will also take this into account to ensure that there is enough stock to meet this value. This will be calculated by taking the minimum pack size to cover the minimum stock.
- Note: if you are using forecasting this can affect suggested order quantity. Please check forecasting settings on mSupply if it is indicated as being used in the spreadsheet.
- Note: The “maximum” quantity field is only a UI feature and does not have any other functionality apart from allowing users to see their recorded maximum quantity. Anything in this field will not be accounted for in the SOQ report.


- Forecast used : Based on forecasting options under “Usage” in “Item details” if this has been used or not (yes / no):

For a more detail guide click on this topic : Stock wastage prediction for ordering.
Suggest order quantities with prices and price extension
This report is an extension of the previous one, allowing you to see what the suggested order will cost. The filter choices you have are the same as for the suggested order quantities report but you get an additional option to say how your suggested order will be priced:

Key Columns in the report output:
- Unit Price: Calculated via the latest price or by supplier quotes or using average prices received during the look back period. The `look back period` is the same setting that is used to calculate average monthly stock usages.
- Price extension (Suggested): This is the predicted cost of a future order based on Unit Price.
- Annual consumption (quantity): This is the predicted stock usage over a year based on the latest average monthly consumption.
- Annual consumption (cost): Potential annual cost based on unit price.
| Previous: 13.03. Transaction reports | | Next: 13.05. Stocktake reports |
13.03. Transaction reports
Transaction based reports are accessed by choosing the Report > Transactions… menu item or by clicking on the Transactions item in the Transactions section on the Reports tab of the Navigator:
![]()
All these reports (and there are many!) summarise supplier or customer transactions in many different formats. Many different filters have been incorporated, allowing filtering on transactions, names, prescribers, items, categories and departments. The filters that do not apply to different reports are hidden as required. Feel free to mix and match and experiment with the filters and different reports to see the different views of information that you can get.
The basic sequence for creating a transaction report is this:
- Select the type of report you want from the Type of report list in the top left.
- Select the date range of transactions you want included in the report in the Date range section.
- Select the transaction type you want the report to run over in the Transaction type section.
- Set any other filters/settings you need to refine the contents of the report (Transaction category, Name, Item, Stock, Prescriber filter etc. sections).
- Click on the OK button to run the report - you can select whether you export it to Excel or print it in the next window that opens (well, mostly - some reports are exported to Excel only so you won't have a choice for them).
See below for more in-depth detail on all these steps.
Standard transaction reports
This is the window you will see:
![]()
Type of report
Choose from several formats for displaying transaction information by:
- selecting the report type in the Report list on the left, and
- choosing the required radio button under Transaction type
The following table lists the available report names, and gives brief details of the information provided by each report .
| Report name | What it does | Sample |
|---|---|---|
| Each invoice grouped by name | The report will sort each invoice in the date range according to the name (Supplier or Customer) and give totals for each name. | Sample |
| Each invoice grouped by date | As above, but totals given for each day. | Sample |
| Each invoice line by item | Lists each batch supplied or received, and the transactions for that item. This report can be very long | Sample |
| Invoice line with donor | As above, but including the 'donor' field and formatted to be most useful for analysis using Excel filtering and Pivot Tables. This report can be long. | |
| Each invoice showing profit | The cost and selling price totals for each invoice are displayed. | Sample |
| Each invoice line grouped by item department then item | The invoice lines are grouped by item department assigned to each item. Each item department is then sorted in alphabetical order. Includes batch information. | Sample |
| Each invoice line grouped by name | The value of batches received/supplied from/to each name. Includes batch level information. | Sample |
| Each invoice line grouped by item and then name | Invoice lines are all displayed, grouped by item and then, within those groups, by name. Includes batch information. | Sample |
| Totals for each item category | The total value for each category will be displayed - each transaction will not be shown. | Sample |
| Totals for each item | Each item that has been received (or issued) will be shown with the total quantity and value received/issued | Sample |
| Totals for each item - Net Inventory adjustment | Each item on which an inventory adjustment has been made is shown; the net adjustment is displayed, with both quantity and value shown. | Sample |
| Totals for each name | The invoice lines for the chosen date range are grouped together for each name. This report allows you to see quickly what has been issued to a customer or customers. | Sample |
| Totals for each item broken down by name | Lists all items, showing their distribution to recipient customers or delivering suppliers | Sample |
| Totals for each item dept broken down by item | Sample | |
| Totals for each name broken down by item | As above, but listing customers or suppliers and items received by or delivered by them | Sample |
| Totals for each item department | The total value supplied/received for each item department is shown | Sample |
| Totals for each item grouped by day | The total quantity and value of each item is shown for each day. | Sample |
| Totals for each item grouped by month. | The total quantity and value of each item is shown for each month. | Sample |
| Totals for each item grouped by item description. | First the report is sorted by item then the total quantity and price of each item is shown. It also provides a grand total for the item quantity and price columns. | Sample |
| 2 period comparison by item category | User selects two periods, and the transactions for each period form a column. The rows are determined by the item category. This is a special report that has different input options. See entry below. | |
| Totals for each item broken down by packsize | The packsize for each item and the number of packs issued. | Sample |
| Prescription and general issues over time | This report shows the quanity of items given to patients and other customers over a period of time, separated by month. It exports to Excel only and has 2 tabs; the By Item tab shows which prescribers prescribed what items and the By Customer tab shows which items were issued to which customers | Sample |
| Prescriber report | This report allows you to view the total value, mean item value and item count for prescriptions dispensed for each prescriber | Sample |
| Dispensing with patient name and prescriber | This report shows who dispensed what to which patients with which directions | Sample |
| Historic prices - Volume weighted average price | This report produces a volume weighted average price for all transactions within the specified time period, for items that are On the price list in the store that you are logged in to. Transactions that have have no transactions or a Cost price of 0 are ignored.Calculations are done on the basis of the Price list Catalogue pack size. (This is normally the same as the Preferred pack size, but not always!) Transactions that are not in the Price list Catalogue pack size will have their calculation adjusted accordingly. Items affected by this will have an asterisk ( *) appended to the Item Description in the report. | |
| Cross tab: items in rows, names in columns, quantity in cells | These reports are like Excel pivot tables. Warning: they can be slow to produce if you have a lot of data. Start with small date ranges until you are comfortable your machine can handle the load. Note that reports that produce a lot of columns won't print well - it is better to export them to a spreadsheet and print from there. | Sample |
| Cross tab: items in rows, names in columns, value in cells | See above | Sample |
| Cross tab: items in rows, days in columns, quantity in cells | See above | Sample |
| Cross tab: items in rows, days in columns, value in cells | See above | Sample |
| Cross tab: items in rows, months in columns, quantity in cells | See above | Sample |
| Cross tab: items in rows, months in columns, value in cells | See above | Sample |
| Cross tab: names in rows, months in columns, quantity in cells | See above | Sample |
| Cross tab: names in rows, months in columns, value in cells | See above | Sample |
| Distribution of quantities issued | First the report is grouped by item name and then by the pack size issued. It displays the total quantity and total count for each item. | Sample |
| Totals for each item grouped by transaction category then item | The report is grouped by each item's transaction category first and then by each item.The report shows the total count, total quantity and total value for each item. Lastly it also calculates a grand total of the items count, quantity and value columns. | Sample |
| Each invoice sorted by Name >Address1 field then by name | The invoices are firstly sorted by the address1 field, and then by the name they were supplied to. This groups invoices together by whatever you entered in the “Address1” field for each name - e.g. you might enter the region or province. | Sample |
| Each invoice sorted byName >Address2 field then by name | As above, but the first sort is by the entry in “Address2” field. | Sample |
| Customer ordered short fall report | Where there has been a shortfall, this report shows the shortfall of each item and of each item category by quantity and percentage. It shows what demand from customers has been met and what has not. It applies only for issues to customers. | Sample |
| Customer transaction report 1 | This report and the following three are, in fact, templates, and are the starting point for designing reports on specific criteria not covered in any of the existing reports. | Sample |
| Customer transaction report 2 | Sample | |
| Customer trans line report 1 | Sample | |
| Customer trans line report 2 | Sample | |
| Received vs. sent | Shows the difference between stock issues from a supplier and stock receipts for the same lines at the customer. If you choose Purchases from suppliers as the Transaction type then the report will run over supplier invoices and show differences between what the current store was sent from the supplying store (on customer invoices) and what the current store received on the corresponding supplier invoices. If you choose Sales to customers as the Transaction type then the report will run over customer invoices and show differences between what was sent from the current store (on customer invoices) and what was received on the corresponding supplier invoices in the receiving store. WARNING: any non stock-transfer transactions included in the report (if you select Normal transactions or Both normal transactions and stock transfers in the Transaction type section) will show a full difference because there is no corresponding customer or supplier invoice. So it is recommended to only choose the Stock transfers option in the Transaction type section for this report. | received_v_sent.pdf |
| Months to expiry | Sample | |
| Order processing time | If you are filling out the order written date and order received date for incoming customer orders, then this report will show you how long it is taking for orders to reach the store, and how long it is taking to process orders from receipt to order entry and to order dispatch | |
| Historic prices - Volume weighted average price | Calculates the Volume weighted average price for all items in the catalogue in those stores (i.e. where the item's On price list checkbox is ticked (see the 4.01.03. Items - Misc(ellaneous) tab page for details)) for all confirmed or finalised supplier invoices within dates provided by the user for all selected stores. Please note: * Transactions where the stock has a cost price = 0 will not be included in the calculation.* Items that have had no transactions within the selected period will not appear in the report. * The On price list checkbox must be set for each store. This will be important if you're running the report over more than one store. |
Transaction type
In the first drop down list, you can choose to report on:
- Sales to customers: customer invoices i.e. transactions of type ci
- Sales to and credits from customers: customer invoices & customer credits i.e ci and cc transaction types
- Purchases from suppliers: supplier invoices i.e. transactions of type si
- Purchases from and credits to suppliers: supplier invoices & supplier credits i.e. si and sc transaction types
- Inventory adjustment - Add stock: All inventory adjustment transactions that resulted in stock additions (e.g. when you did a stock take of an item and counted more on the shelf than the total shown in mSupply).
- Inventory adjustment - Reduce stock: All inventory adjustment transactions that resulted in stock reductions (e.g. discarding stock due to it being expired). Note that using a report that shows the total for each transaction category can give totals for expired/damaged etc.
- Inventory adjustment - Net movement: Taking into account both reductions and additions, the nett change in inventory due to adjustment transactions.
- Customer invoice cancellations: These are the “inverse” invoices created when a customer invoice is cancelled
- Credits to customers: The credits applied to customers when invoices are cancelled or when goods are returned.
- Payment cancellations: The “inverse” payments created to reverse a payment made by a customer for a customer invoice that has a payment against it and has been cancelled.
In the second drop down list, you have the following options:
- Both normal transactions and stock transfers: this is the default option and means that both stock transfer and non-stock transfer transactions will be included in the report
- Normal transactions: all transactions that are not stock transfers will be included in the report
- Stock transfers: only stock transfers will be included in the report
A stock transfer is a transaction made when the supplier or customer is another store in your datafile. A normal transaction is when the customer or supplier is a normal customer or supplier in your datafile, and not a store.
Date range
Enter the date range of transactions to report on, having selected Confirmed date or Shipping date. Note that the date used may differ from the original entry date, depending on how your system is configured in the Preferences.
- Note the popup menu to the right of the date entry fields that allows you to choose quickly from a list of common date ranges:

- Note that “last year” refers to the year preceding the current year (that is, if the current year is 2012, choosing “last year” will set the dates from 1st Jan 2011 to 31st Dec 2011).
Transaction category filter
Assuming you have set up transaction categories, your report may be filtered by category. For help setting up Transaction categories click see sectrion 22.07. Transaction categories.
- Transaction source: Options are “All”, “Customers, Suppliers and Stores” or “Patients”. This allows you to select the type of Name the transactions must belong to. If you select Patients, only transactions which have a name that is a patient will be inccluded in the results (e.g. prescriptions). If you select Customers, Suppliers and Stores then transactions that have a name which is a normal supplier (e.g. supplier invoice) or customer (e.g. customer invoice) or store (e.g. stock transfer) will be included in the report. If you select All then this filter is effectively not used and transactions with any name type are included in the report.
- Transaction category: Use the magnifying glass to choose the transactions categories to be included in the report. Note that you can select more than one category. The types of categories offered in the list will match your selection in the Transaction type section.
- Master transaction category: If you prefer, you can choose to filter by master transaction category instead. Master transaction categories are used to group together transaction categories (so selecting one of these is like selecting multiple categories in the Transaction category filter - it's just more convenient to do it this way if you regularly need to choose several. We love to make things easier for you!). Again, see 22.07. Transaction categories for details on setting them up.
Name filter
You can enter a particular customer code or category of transactions to be displayed.
- You can choose from either equals for an exact match or starts with to search for all names whose code or category starts with the entered text.
- Each name has 6 different categories that can be used to group certain kinds of names together. You can filter on category 1 (which is hierarchical) using the Category 1 filter in the screenshot at the top of the page (note that the Category 1 text will be replaced with any name you have assigned to this category in the preferences) and one of the other categories using the Category 2 filter shown in the screenshot at the top of the page.
- If you want to report on transactions for a single name, you can find their code by looking up their details using Supplier > Show suppliers or Customer > Show customers.
- There is also a Customer group filter you can use to include names based on their customer group.
Item filter
Here you can specify the items to include in the report.
Note that sometimes the item choice options will be hidden because the chosen report is reporting on transactions, not on transaction lines:
![]()
Donor filter
If you have donor tracking turned on in the preferences, and choose a report that bases it's data on invoice lines, then you will be given the option to filter the report for a particular donor or group of donors.
Which mode?
If you are using mSupply in both store and dispensary mode, you might want to report only on transactions in store mode (items distributed to customers) or in dispensary mode (items distributed to patients). You can do this by checking Store mode or Dispensary mode radio button depending on your requirements.
Exclude transfers from calculations
This checkbox enables you to choose whether you include stock transfers (where stock is transferred from one store to another in mSupply) in the report calculations. If you want stock transfers to be included in your report then uncheck this checkbox. If you want stock transfers to be left out of the report then check this checkbox.
Include nw or sg status transactions
By default only confirmed ('cn') or finalised ('fn') status transactions (i.e. those that have affected stock) will be included in transaction reports. If you want to also include new ('nw') or suggested ('sg') status transactions in your report (i.e. those that have not affected stock yet) then check the Include nw or sg status transactions checkbox.
Note that, for confirmed and finalised transactions, the confirmed date is used to compare with the date filter to decide whether it is included in the report or not. New and suggested transactions do not have a confirmed date so the entered date is used instead to compare against the date filter.
The 2 period comparison by item category report
This report allows you quickly to compare sales or purchases for 2 periods of your choice based on item categories.
When you choose this report a different set of options is shown.
![]()
Set the date range for each of the columns and then choose a summary level. It should be noted that if no data is present for the first period defined, this report will not run.
Dot notation and summary levels
The summary level is based on the item category field. If you have set up item categories using dot notation, then you can summarise categories.
To set up item categories, choose Items > Show item categories
Take the following simple example of categories that have been set up as follows:

The rules for dot notation are
- Separate each level of your hierarchy with a period (dot).
- Within a level you can have as many characters as you like
- You can use any characters, as long as you don't use a period or a space within one level; e.g. “surgical.gloves.small” is a valid entry. (Level one is “surgical”, level two is “gloves” etc.).
- When the hierarchy part of the category name is finished enter a space character. You can then enter a description for that level of the hierarchy.
If we run the report with a summary level of “none” each category is shown
![]()
If we run the same report with level one chosen, only the first level of the hierarchy is shown. Items with categories 1.1 and 1.2 and 1.1.1 have all been summarised under “1 Antibiotics”
![]()
And with level two chosen, items with category 1.1.1 and 1.1.2 are summarised under the heading “1.1 Penicillins”
![]()
Note that if you have items to which no category has been assigned, they are shown under the heading `none“ at the top of the report.
The categories are printed in the order that you have specified by drag-and-dropping in the window shown by choosing Item > Show item categories….
Transaction filter: Filters the report for given category
Prescriber filter: Reduces the found transactions to those for the given prescriber only, depending upon the selection made (equals, starts with, contains, is not equal to).
- Obviously only useful in dispensary mode.
Exclude transfers from calculations: The check-box Exclude transfers from calculations when checked will ignore transfers between stores within the organisation.
Exclude Ad Hoc and non stock items: The check-box Exclude Ad hoc and non stock items is displayed accordng to the type of report selected. By default, it is checked.
When checked, the transaction report generated will not include any Ad Hoc items or non stock items (items you don't normally keep in stock).
Custom transaction and trans lines reports
These four reports should be regarded as templates for you to design your own report .
Having decided whether you wish to report on transactions or transaction lines, you need to design the report according to your specific needs. Coose Reports > Manage Reports :
You are presented with the Report management window. In this example, our report will be on transactions, so you should highlight custom_transaction_report_1 , and click onthe Duplicate report button:

Choose an appropriate name for your report, and any comment you wish, and click OK. You are returned to the Report management window, where you should scroll down until you reach the report you have created; note that the name you gave the report will appear in the Custom name column; highlight the row and click Edit report .

This brings up the Edit report window. Creating custom reports is described in detail earlier in this chapter. See the Custom Reporting Tutorial
Save template button
The save template button allows you to save a given report as a template once you have input your chosen settings. Templates can be reused as needed.
Pressing the Save Template button brings up the following window:

This dialog allows you to set a name and description for the report template. You can also define user permissions: at the moment, you can define these as ‘Public’ - for anyone, or ‘Private’, in which case the permissions only apply to the user who created the template.
- View Preferences: define which stores will be able to view and use the template on the ‘Manage Reports’ tab (next screenshot).
- Edit Preferences: define which stores will be able to edit or delete templates on the ‘Manage Reports’ tab.

- Displays all template reports that the user has permissions to view.
- Allows user to use the template:
- Redirects user to ‘Create Report’ tab
- Settings here will be set according to the preferences of the template report
- Users can also edit, delete, and duplicate the reports if user permissions allow.
- Duplicated reports will be named ‘ReportName[duplicate]’
- Quick search searches in all text columns of the table.
Pivot table friendly transaction report
There is an almost infinite range of reports that you might want to generate from transaction data. If you are comfortable using Excel Pivot tables, there is an mSupply transaction report format that you will likely find quite useful. This report has been designed to work in Supervisor Mode but will also work in a single store.
To generate it:
- click on Reports > Transaction
- After configuring the various date range, Item, Name, transaction type, etc. filters
- Select the Each Invoice Line by Item report in the top left
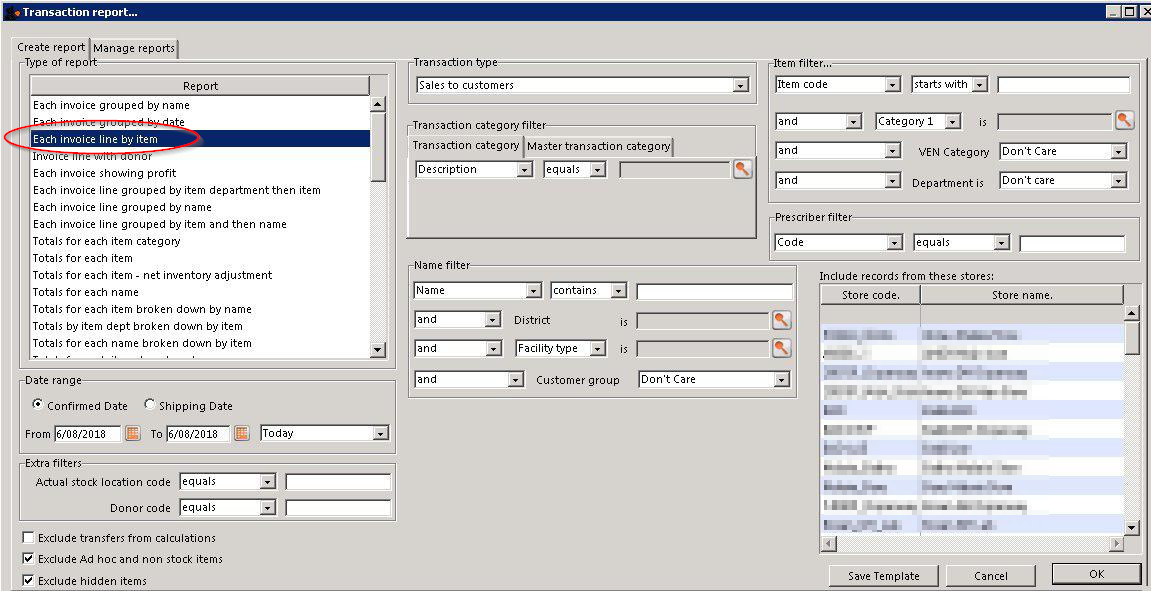
- Then, select
CustomTransactionByItemreport type and send the output to Open in Excel

![]()
The report will open in Excel in a form that can then be easily filtered, sorted and manipulated through a Pivot table. If fact, the records are not sorted at all, so they must be processed to make any sense!
| Previous: 13.02. Stock and items reports | | Next: 13.04. Purchasing reports |
13.11. Other reports
ABC analysis

This report will rank the items based on the value sold in the period specified. Sometimes such a report is referred to as an “ABC” analysis or a “pareto” analysis. Statistics show that 20% of the items supplied by an organisation usually generates 80% of the total value of sales. Therefore, it is useful (and wise!) to concentrate first on the 20% of items that are most important. This report makes it easy to do just that.
You might be interested in what Wikipedia has to say about ABC analysis
You need to enter the following information:
Number of items to include in report: Enter the number of items to be included in the report.
Date range: Enter the dates you wish here. Each item will have its “analysis” field updated with the total value of sales during the period specified.
Filters: Should you wish to apply filters to the report, three are available - for items, categories and departments.
Which mode: You can choose store mode, dispensary mode or both modes of transactions for inclusion in the report.
Exclude Ad Hoc and non stock items: If you check this box then Ad Hoc and non stock items will not feature in the report.
The report lists the number of items specified, ranked by value of sales, starting with the highest. The value of sales and the percentage of the total value are also shown. Note that the total value is the total for the items in the report, not the total sales for all items. If you want to report on the total for all items, set the Number of items to report on to a number greater than the number of items in your data file (Note that this may make the report very long, but you can choose just to print the first few pages if you wish).
Management summary
This report is designed with line managers in mind, or other people who want to “keep their finger on the pulse” of their organisation but are not interested in the fine detail!
You'll be shown a window where you can choose a date range for the report:

The report provides the following information:
- The total value of stock on hand
- The 10 items with the largest stock value
- The 10 items with the largest value of supply to customers in the date range chosen.
- The 10 suppliers from whom you have purchased the most in the date range chosen.
- The 10 customers to whom you have supplied the most in the date range chosen.
- If you check the “Include section on expiring items” checkbox, a section will be included that lists:
- The cumulative liability for expiring items for each of the next 12 months.
- The 12 most valuable expiring items (or at least batches of particular items)
Preview on screen before printing
Check this box if you want to view your report on screen first.
Open report in Excel
Check this box to view the report directly in your chosen Spreadsheet program.
Quotation summary

There are two options in Report on section, namely: All quotations and Preferred quotations , and there are two options in Group together by section, namely Supplier and Item
All quotations shows the quotations in which Preferred is set to “true or false”.
Preferred quotations shows only those quotations in which Preferred is set to “true”.
Supplier option displays the quotation report on the basis of supplier.The quotations for the items related to a particular supplier are listed along with that supplier.
Item option displays the quotation report with the items arranged in alphabetical order along with the corresponding supplier's name.
In addition there are filters allowing you to narrow your search further by:
- limiting the report to suppliers meeting your specified criteria - e.g. the supplier's name code may be entered, so the resulting report will display only quotations from that particular supplier.
- specifying criteria relating to the item by choosing from the many options in the drop-down boxes as shown below:

There is an additional filter, the Date filter, allowing you to specify the dates on which the Quotations you are examining were created or modified, and the radio button toggles display of the quotations' expiry date ( Quotation valid date ) on or off.
Sync report
This report allows you to track simple remote site activity. There is more in depth remote site activity available on the mSupply dashboard (see the https://docs.msupply.foundation/dashboard/introduction/ page for details). To run it, choose Report > Sync report… from the menus. There are no filters and the report will open automatically in your default spreadsheet application. It looks like this:

Debtors and creditors
The following reports are available:

Select the required report by clicking on it.
Debtors
This report will produce a list of all debtors. mSupply uses an open-invoice system of accounting for debtors, so the outstanding amount for each debtor is displayed; for debtors with more than one invoice outstanding, the amount displayed is the cumulative total of all outstanding invoices.
Note that the total outstanding on invoices is not reduced for any previous overpayment by a customer, but this is listed in a separate column in the report.
To remove overpayment amounts from the system, choose customer | new payment… and enter the name of the customer with an overpayment. You will be asked if you want to use the overpayment amount for this payment. Choose use, then allocated the overpayment to outstanding invoices.
Creditors
Aged debtors
Customer statements
You will be presented with a window to find customers.

If you want a report for all customers, leave the entry field blank. Click OK and a report will be produced for any customers who match the criteria entered. Note that customers with no amount outstanding will not have a statement printed for them.
Transport report
This report allows you to print information about the transport details for a range of invoices.
First you are shown a window where you can select a date range and choose to report on only invoices supplied by a particular method, by a particular responsible officer, or to a particular name or names.

Click “OK” to run the report.
Note that transport details can only be entered on customer invoices if you have checked the “We use box numbers” option in the Preferences
Prescriber report
The Prescriber report allows you to view the total value, mean item value and item count for prescriptions dispensed for each prescriber.
You will be shown a window with the normal date range options, and the option to report only on prescibers whose type field is set to a certain type.
Click OK to proceed.
The window that appears is the Transactions report, but you will see that the Prescribers report is highlighted.

As usual, the report options window is shown where you can choose the destination and set headers and footers.
User activity totals
This report was initially made for use in dispensing situations where you want a quick count of the number of prescriptions and items issued in a day. However, it is also useful for getting a quick view of workload for a month or a year in store mode. This report gives the number of supplier invoices (or prescriptions) and the number of stock lines on them, reported by user.
Choosing this menu item shows a window like this (once you have selected a date range).

You can drop down to view data by clicking on the green arrows. Alternatively, you can click on the printer icon on the bottom right and export the full list to Excel.
Date range
You can either enter dates manually or choose from the drop-down list to the right of the date fields.
Time range
Enter times here in 24 hour format (e.g.. 9:00 in the “from” field and 17:00 in the “to” field. Leaving these fields on 00:00:00 will calculate for the whole day.
To calculate totals, click the Show button. If there are a lot of transactions to evaluate, a progress bar will be shown.
Click the OK button to close the window when you are finished.
Backorder report
This report shows the backorders that have been placed for items. Backorders are made when there is insufficient stock to meet the requirements of an order placed by the customer. Information about the item code, item name, current stock, customer code, the backordered quantity (number of units, not packs) and the date of the backorder is displayed.
If you are running a backorder system this gives you a quick way to check if backordered items are now in stock so they can be supplied to customers.
Suggest price list additions
Note: the price list menu items are for those organisations that produce a price list or price indicator. (It is useful to call your publication a “price indicator”, as it implies the published price is a guide, and not a fixed price). You are asked to specify the number of transactions and the number of months (e.g. 2 transactions in the last 3 months) that would make an item eligible for inclusion in the price list. A search is performed using the criteria you enter, and a list of items is shown that meet the criteria but are marked as not being in your price list. You can double-click on items in the list and click their “price list” check box to add them to the price list.
Update price list
This item updates the catalogue or price list prices of items with prices from their current stock lines. All items have separate catalogue prices in each store and they are displayed on the Misc tab of an item's details window catalogue (see the 4.01.03. Items - Misc(ellaneous) tab page for details).
When you click on the Update price list option, the report options window is shown, allowing you to check what price is used:

- the price of the largest batch in stock: sets the price list (catalogue) price to the sell price of the batch with the largest number of units (pack size x number of packs) in stock.
- the price of the highest priced batch in stock: sets the price list (catalogue) price to the sell price of the batch with the highest price (i.e. highest sell price/batch pack size value) of all current batches in stock.
Note that in both options, the Catalogue pack size is also set to the pack size of the batch that is used to set the catalogue price.
Only items whose On price list check box is checked are updated. If no items have this checked then mSupply aill tell you so and the update won't run.
Note that if an item has no stock, then the price for that item will not be altered.
mSupply will show you the progress of the update and will also tell you when it is complete.
It is a good idea to run the “suggest price list additions” report before running this function.
Price list
Only items that are marked as included in the price list (Item > Misc tab) are placed in a report, whether or not you have any in stock.
If you wish to export to a text file, choose “save to disk” in the report options dialog that is shown.
The exported file has fields separated by tabs and records separated by returns. The field order is:
- Item
- pack size
- price.
If you wish to include different information, you can create a custom report to do this.
Location report
This report is available in version 1.96 and later.
This report lists the location description, type, capacity, used volume and percentage available. Choosing this menu item shows you the location report filter options widnow as below:

The report may be restricted to certain locations by using specific search criteria. Choose either “Code” or “Volume” from left drop-down list is . The centre drop-down list allows you to choose a comparitor.

You have to make an appropriate entry on the right-hand field. Leaving the field blank means no filter will be applied.
Location type
It allows you to choose a location type. You can select the one from the drop-down list on the right side. The graphic of location type is shown below.

For example, you can specify the location type“COOL” to show only refrigerated locations.
Check the “open in Excel” checkbox if you wish to directly open the saved report in Excel (or any installed spreadsheet).
Click the OK button to run the report.
Manage reports
Choosing this item shows a list of built-in reports and any custom reports which have been designed:
The built-in reports may well be sufficient for your needs, but mSupply's versatility allows you to manage the reports to meet any specific requirements you have.
Options in the Report Management window:
Delete selected reports
Report(s) no longer required may be selected and deleted from mSupply
Duplicate report
Should one of the built-in reports not quite meet your needs, you have the opportunity to create a duplicate of that report, and then modify it to meet your needs. The first step is to select the closely matching in-built report; in our example we'll use the expiring_items_date report, then click on the Duplicate report button;

the window that appears has already selected a name for your report, using the name of the in-built report prefixed by “ my_ ”; you may change this name should you wish. The Permissions drop down list allows you to specify users having access to your report; the options are All users , or Only me . Should you wish your report to become the default one rather than the in-built report, then check the Make default checkbox. When you click on OK, the report you have just created now appears at the foot of the list of reports from the item on the menu Report>Manage reports.
Edit report
The editing of reports using the powerful editor has been extensively covered earlier in this section.

Using the report editor is complex, but it has the potential to produce a wealth of useful information. Contact Sustainable Solutions for a link to download a separate manual on the subject.
Note that in a multi-user installation, changes you make to a report will affect all users, so don't change a report without some forethought.
Add report
Click on this button, and the following window appears

Revert selected reports
This button allows intrepid souls to save face by undoing the damage they have done to a particular report! The report that was installed with mSupply will be reloaded from the disk, and any changes you have made to the version stored with the data will be discarded.
Revert all
This button returns all in-built reports to their original state when you installed mSupply; exercise caution when using it. Custom reports which you have designed are not affected.
Save selected reports
All reports are automatically saved by mSupply in the default folder. There may be occasions when you wish to save one or more reports on a removable storage medium - e.g. a pen drive - and this button allows you to do this; a window appears allowing you to specify the location in which you wish to save the selected reports.
| Previous: 13.10. ATC and DDD code based reports | | Next: 13.12. Manage reports |